
November existing home sales and median price accelerate from year ago
- Existing, single-family home sales totaled 442,320 in November on a seasonally adjusted annualized rate, down 0.1 percent from October and up 17.7 percent from November 2015.
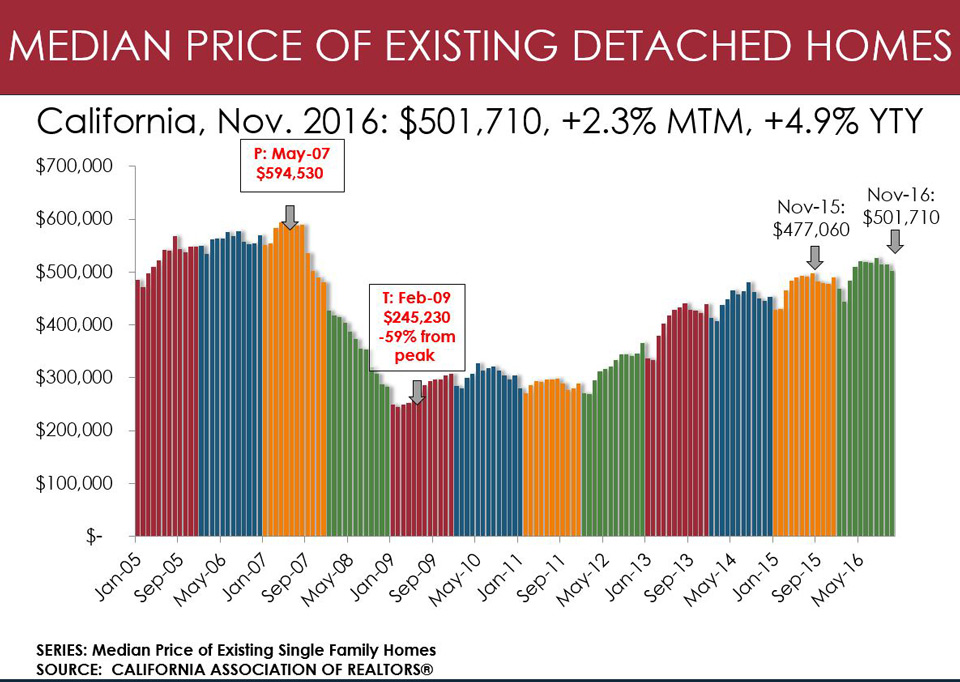
- November’s statewide median home price was $501,710, down 2.3 percent from October and up 4.9 percent from November 2015.
- Demand for homes continued to outstrip supply, causing the Unsold Inventory Index to decline to 3.1 months in November from 4.2 months in November 2015.
December 23, 2016 - LOS ANGELES – Following last year’s new mortgage industry regulations that delayed some escrow closings, double-digit annual sales increases across every major region of the state propelled California existing home sales higher in November on a year-over-year basis, the CALIFORNIA ASSOCIATION OF REALTORS® (C.A.R.) said today.
Closed escrow sales of existing, single-family detached homes in California totaled a seasonally adjusted annualized rate of 442,320 units in November, according to information collected by C.A.R. from more than 90 local REALTOR® associations and MLSs statewide. The statewide sales figure represents what would be the total number of homes sold during 2016 if sales maintained the November pace throughout the year. It is adjusted to account for seasonal factors that typically influence home sales.
The November figure was down a negligible 0.1 percent from the 442,970 level in October and up 17.7 percent compared with home sales in November 2015 of a revised 375,850. Home sales remained above the 400,000 pace for the eighth straight month, and were up year-over-year for the third consecutive month. The seasonally-adjusted annualized sales figure was the third highest level since December 2012, and the year-over-year increase was the largest since 2009, when first-time home buyer tax credits fueled home sales.
“November’s strong sales gain from last year can be partly attributed to weak sales caused by the Consumer Financial Protection Bureau’s implementation of Know Before You Owe TILA-RESPA Integrated Disclosure (TRID) last October, which cut into sales that would have occurred last November,” said C.A.R. President Geoff McIntosh. “Additionally, near-universal expectation of the Federal Reserve’s rate increase may have given many buyers a sense of urgency to get into the market before rates rise further.”
It’s important to note that many, if not most, of these closed sales would have been under contract prior to the presidential election, so the sales increase cannot directly be attributed to the effect of the election or the subsequent rise in rates that followed immediately afterward.
The statewide median price decreased for the third straight month but remained above the $500,000 mark for the eighth consecutive month. The median price of an existing, single-family detached California home was down 2.3 percent in November at $501,710 from a revised $513,520 in October.
November’s median price increased 4.9 percent from the revised $478,140 recorded in November 2015. The median sales price is the point at which half of homes sold for more and half sold for less; it is influenced by the types of homes selling, as well as a general change in values. The monthly price decline is primarily due to seasonal factors.
“The Federal Reserve’s announcement last week to raise the federal funds rate has been anticipated and should only have a minor, if any, adverse impact on the housing market in the next couple of months since rates are still historically low. Yet, future rate hikes will further increase the cost of a mortgage, which could impact home sales in 2017 and beyond,” said C.A.R. Senior Vice President and Chief Economist Leslie Appleton-Young. “Moreover, with the specter of rates drifting higher, more buyers may rush in to buy homes and compete for a dearth of homes available for sale, which could put upward pressure on home prices and lead to a further decline in affordability.”
Other key points from C.A.R.’s November 2016 resale housing report include:
• With a significant uptick in closed sales, C.A.R.’s Unsold Inventory Index, which indicates the number of months needed to sell the supply of homes on the market at the current sales rate, declined on both a monthly and annual basis. The index slipped to 3.1 months in November from 3.4 months in October. The index stood at 4.2 months in November 2015.
• With the jump in home sales, new statewide active listings continued to decline, falling 11.7 percent from October and 6.2 percent from a year ago.
• The median number of days it took to sell a single-family home edged up negligibly from 29.4 days in October to 29.7 days in November but was down from a revised 37.6 days in November 2015.
• C.A.R.’s sales-to-list price ratio* was 98.3 of listing prices statewide in November, 98.4 percent in October and 98.1 in November 2015.
• The average price per square foot** for an existing, single-family home statewide was $250 in November, $247 in October, and $236 in November 2015.
• San Francisco County had the highest price per square foot in November at $804/sq. ft., followed by San Mateo ($783/sq. ft.), and Santa Clara ($602/sq. ft.). Counties with the lowest price per square foot in November included Siskiyou ($124/sq. ft.), Madera ($127/sq. ft.), and Kings ($130/sq. ft.).
• Mortgage rates have steadily increased over the past several weeks, with the 30-year, fixed-mortgage interest rate averaging 3.77 percent in November, up from 3.47 percent in October but down from 3.94 percent in November 2015, according to Freddie Mac. The five-year, adjustable-rate mortgage interest rates also rose in November to an average of 2.99 percent, up from 2.83 percent in October but down negligibly from 3.0 percent in November 2015.
Graphics (click links to open):
• November sales at-a-glance infographic.
• Calif. historical existing home sales.
• Share of sales by price range.
• Calif. historical price per square foot.
• Calif. historical median home price.
• Calif. historical unsold inventory index.
Note: The County MLS median price and sales data in the tables are generated from a survey of more than 90 associations of REALTORS® throughout the state, and represent statistics of existing single-family detached homes only. County sales data are not adjusted to account for seasonal factors that can influence home sales. Movements in sales prices should not be interpreted as changes in the cost of a standard home. The median price is where half sold for more and half sold for less; medians are more typical than average prices, which are skewed by a relatively small share of transactions at either the lower-end or the upper-end. Median prices can be influenced by changes in cost, as well as changes in the characteristics and the size of homes sold. The change in median prices should not be construed as actual price changes in specific homes.
*Sales-to-list price ratio is an indicator that reflects the negotiation power of home buyers and home sellers under current market conditions. The ratio is calculated by dividing the final sales price of a property by its last list price and is expressed as a percentage. A sales-to-list ratio with 100 percent or above suggests that the property sold for more than the list price, and a ratio below 100 percent indicates that the price sold below the asking price.
**Price per square foot is a measure commonly used by real estate agents and brokers to determine how much a square foot of space a buyer will pay for a property. It is calculated as the sale price of the home divided by the number of finished square feet. C.A.R. currently tracks price-per-square foot statistics for 39 counties.
Leading the way…® in California real estate for more than 110 years, the CALIFORNIA ASSOCIATION OF REALTORS® (www.car.org) is one of the largest state trade organizations in the United States with 185,000 members dedicated to the advancement of professionalism in real estate. C.A.R. is headquartered in Los Angeles.
November 2016 County Sales and Price Activity
(Regional and condo sales data not seasonally adjusted)
| November-16 | Median Sold Price of Existing Single-Family Homes | Sales | |||||||
| State/Region/County | Nov-16 | Oct-16 | Nov-15 | MTM% Chg | YTY% Chg | MTM% Chg | YTY% Chg | ||
| CA SFH (SAAR) | $501,710 | $513,520 | r | $478,140 | r | -2.3% | 4.9% | -0.1% | 17.7% |
| CA Condo/Townhomes | $416,700 | $419,800 | $397,350 | r | -0.7% | 4.9% | -4.6% | 21.4% | |
| Los Angeles Metro Area | $461,540 | $464,230 | $441,390 | r | -0.6% | 4.6% | -5.3% | 27.3% | |
| Inland Empire | $317,720 | $314,390 | $293,220 | 1.1% | 8.4% | -1.0% | 31.2% | ||
| S.F. Bay Area | $809,150 | $810,390 | $745,440 | r | -0.2% | 8.5% | -3.1% | 18.7% | |
| S.F. Bay Area | |||||||||
| Alameda | $800,000 | $780,000 | $730,000 | r | 2.6% | 9.6% | 0.4% | 20.0% | |
| Contra-Costa | $569,000 | $540,000 | $550,000 | r | 5.4% | 3.5% | 3.3% | 22.4% | |
| Marin | $1,050,000 | $1,225,000 | $1,200,000 | r | -14.3% | -12.5% | -27.8% | 0.7% | |
| Napa | $637,500 | $618,250 | $689,400 | r | 3.1% | -7.5% | -5.7% | 1.0% | |
| San Francisco | $1,360,500 | $1,407,500 | $1,300,000 | r | -3.3% | 4.7% | -10.7% | 11.7% | |
| San Mateo | $1,216,750 | $1,350,000 | $1,195,000 | -9.9% | 1.8% | -5.2% | 16.1% | ||
| Santa Clara | $1,010,000 | $1,047,500 | $965,000 | -3.6% | 4.7% | -4.7% | 25.8% | ||
| Solano | $380,000 | $392,500 | $355,000 | r | -3.2% | 7.0% | -4.8% | 26.7% | |
| Sonoma | $578,000 | $595,000 | $527,000 | r | -2.9% | 9.7% | 1.1% | 6.1% | |
| Southern California | |||||||||
| Los Angeles | $483,830 | $533,370 | $457,110 | r | -9.3% | 5.8% | -7.1% | 25.3% | |
| Orange | $734,500 | $750,000 | $705,000 | r | -2.1% | 4.2% | -6.3% | 26.0% | |
| Riverside | $352,500 | $355,950 | $330,000 | r | -1.0% | 6.8% | -1.5% | 32.5% | |
| San Bernardino | $253,140 | $247,590 | $236,220 | 2.2% | 7.2% | -0.2% | 29.3% | ||
| San Diego | $557,000 | $576,620 | $532,380 | r | -3.4% | 4.6% | -2.9% | 32.5% | |
| Ventura | $630,250 | $631,330 | $623,400 | -0.2% | 1.1% | -10.7% | 21.3% | ||
| Central Coast | |||||||||
| Monterey | $515,000 | $499,900 | r | $512,500 | 3.0% | 0.5% | -0.9% | 8.6% | |
| San Luis Obispo | $560,000 | $538,500 | $530,810 | r | 4.0% | 5.5% | 16.7% | 29.4% | |
| Santa Barbara | $719,500 | $595,000 | $650,000 | r | 20.9% | 10.7% | 1.0% | 31.8% | |
| Santa Cruz | $795,000 | $799,900 | $703,750 | -0.6% | 13.0% | 5.8% | 15.1% | ||
| Central Valley | |||||||||
| Fresno | $238,000 | $235,000 | $225,000 | r | 1.3% | 5.8% | -6.7% | 31.7% | |
| Glenn | $215,000 | $185,050 | $190,000 | r | 16.2% | 13.2% | -27.8% | -27.8% | |
| Kern | $225,000 | $227,000 | $219,000 | r | -0.9% | 2.7% | -4.7% | 4.9% | |
| Kings | $210,000 | $217,000 | $185,000 | r | -3.2% | 13.5% | 6.0% | 35.4% | |
| Madera | $212,950 | $227,500 | $220,000 | r | -6.4% | -3.2% | -34.3% | -24.6% | |
| Merced | $215,000 | $233,250 | $215,000 | r | -7.8% | 0.0% | -10.7% | 38.0% | |
| Placer | $427,000 | $436,000 | $397,750 | r | -2.1% | 7.4% | 1.4% | 27.9% | |
| Sacramento | $325,000 | $320,000 | $290,000 | r | 1.6% | 12.1% | -6.8% | 20.1% | |
| San Benito | $503,090 | $506,000 | $512,500 | -0.6% | -1.8% | 14.9% | 68.8% | ||
| San Joaquin | $319,000 | $320,000 | $292,500 | r | -0.3% | 9.1% | -4.1% | 45.3% | |
| Stanislaus | $271,500 | $280,000 | $249,500 | r | -3.0% | 8.8% | -6.5% | 31.1% | |
| Tulare | $217,500 | $205,000 | $174,900 | r | 6.1% | 24.4% | 4.3% | 41.6% | |
| Other Calif. Counties | |||||||||
| Amador | $275,000 | $276,500 | $285,000 | r | -0.5% | -3.5% | -19.6% | 60.7% | |
| Butte | $279,000 | $293,000 | $235,000 | r | -4.8% | 18.7% | -18.8% | 11.5% | |
| Calaveras | $268,500 | $300,050 | $246,250 | r | -10.5% | 9.0% | -23.5% | -11.4% | |
| Del Norte | $225,000 | $264,500 | $265,000 | r | -14.9% | -15.1% | 47.4% | 115.4% | |
| El Dorado | $442,000 | $419,000 | $394,950 | r | 5.5% | 11.9% | -20.7% | 20.9% | |
| Humboldt | $289,000 | $305,000 | $275,000 | r | -5.2% | 5.1% | 8.2% | 45.1% | |
| Lake | $259,000 | $262,500 | $256,000 | r | -1.3% | 1.2% | -9.0% | -19.3% | |
| Mariposa | $258,250 | $267,250 | $276,000 | r | -3.4% | -6.4% | 0.0% | 40.0% | |
| Mendocino | $371,500 | $360,000 | $369,000 | r | 3.2% | 0.7% | 2.1% | 11.6% | |
| Mono | $618,750 | $379,000 | $548,000 | 63.3% | 12.9% | 100.0% | 100.0% | ||
| Nevada | $358,500 | $360,000 | $341,250 | r | -0.4% | 5.1% | -2.7% | 21.3% | |
| Plumas | $266,000 | $215,000 | $213,500 | r | 23.7% | 24.6% | -11.4% | 0.0% | |
| Shasta | $250,000 | $249,000 | $236,250 | r | 0.4% | 5.8% | -5.0% | 45.5% | |
| Siskiyou | $183,000 | $182,500 | $160,000 | r | 0.3% | 14.4% | -11.4% | 5.4% | |
| Sutter | $259,000 | $250,500 | $260,000 | r | 3.4% | -0.4% | -10.7% | 25.0% | |
| Tehama | $235,000 | $163,000 | $150,000 | r | 44.2% | 56.7% | 11.4% | 25.8% | |
| Tuolumne | $260,000 | $221,000 | $238,750 | r | 17.6% | 8.9% | 18.8% | 22.6% | |
| Yolo | $375,000 | $381,250 | $400,000 | r | -1.6% | -6.3% | -8.3% | 11.0% | |
| Yuba | $265,000 | $236,000 | $202,000 | r | 12.3% | 31.2% | -8.9% | 22.0% | |
r = revised
November 2016 County Unsold Inventory and Time on Market
(Regional and condo sales data not seasonally adjusted)
| November-16 | Unsold Inventory Index | Median Time on Market | ||||||||
| State/Region/County | Nov-16 | Oct-16 | Nov-15 | Nov-16 | Oct-16 | Nov-15 | ||||
| CA SFH (SAAR) | 3.1 | 3.4 | 4.2 | 29.7 | 29.4 | r | 37.6 | r | ||
| CA Condo/Townhomes | 2.6 | 2.8 | 3.4 | 28.5 | 28.1 | 34.1 | r | |||
| Los Angeles Metro Area | 3.6 | 3.8 | 4.9 | 42.2 | 43.2 | 53.4 | ||||
| Inland Empire | 4.1 | 4.3 | 5.7 | 46.2 | 45.6 | 56.1 | ||||
| S.F. Bay Area | 1.9 | 2.3 | 2.2 | r | 25.3 | 24.3 | 24.7 | r | ||
| S.F. Bay Area | ||||||||||
| Alameda | 1.5 | 2.0 | 2.0 | 20.2 | 20.5 | 19.2 | ||||
| Contra-Costa | 1.9 | 2.5 | 1.3 | 22.3 | 21.1 | 22.4 | ||||
| Marin | 2.5 | 2.6 | 2.5 | 46.6 | 34.0 | 41.2 | r | |||
| Napa | 4.1 | 4.5 | 4.3 | 54.0 | 61.0 | 61.8 | r | |||
| San Francisco | 1.7 | 2.1 | 1.8 | 26.4 | 19.9 | 22.5 | ||||
| San Mateo | 1.6 | 2.1 | 2.0 | r | 21.0 | 20.8 | 19.8 | |||
| Santa Clara | 1.6 | 2.0 | 2.2 | r | 22.8 | 22.0 | 21.9 | |||
| Solano | 2.4 | 2.7 | 3.4 | r | 42.9 | 43.0 | 47.5 | r | ||
| Sonoma | 2.3 | 2.9 | 3.0 | 52.3 | 50.5 | 51.4 | r | |||
| Southern California | ||||||||||
| Los Angeles | 3.3 | 3.5 | 4.5 | r | 33.3 | 35.6 | 47.4 | r | ||
| Orange | 3.3 | 3.6 | 4.3 | 47.7 | 49.1 | 61.4 | ||||
| Riverside | 4.3 | 4.5 | 6.2 | 45.9 | 47.4 | 56.5 | ||||
| San Bernardino | 3.6 | 4.0 | 5.0 | 46.7 | 42.2 | 55.5 | ||||
| San Diego | 3.0 | 3.3 | 4.3 | 24.3 | 24.3 | 25.4 | ||||
| Ventura | 3.8 | 3.9 | 5.0 | 57.9 | 58.1 | 59.5 | ||||
| Central Coast | ||||||||||
| Monterey | 4.4 | 4.9 | 4.7 | r | 33.8 | 35.8 | 28.3 | |||
| San Luis Obispo | 3.5 | 4.8 | 4.8 | 46.4 | 35.6 | 36.1 | ||||
| Santa Barbara | 4.5 | 5.1 | 5.4 | r | 32.7 | 29.6 | 36.5 | r | ||
| Santa Cruz | 2.9 | 3.8 | 3.6 | r | 28.0 | 34.2 | 37.0 | |||
| Central Valley | ||||||||||
| Fresno | 4.0 | 3.8 | 5.9 | 25.8 | 24.9 | 28.2 | ||||
| Glenn | 5.8 | 5.0 | 4.0 | 52.8 | 31.0 | 70.7 | ||||
| Kern | 4.0 | 4.1 | 4.6 | r | 29.7 | 31.5 | 36.8 | r | ||
| Kings | 3.1 | 3.4 | 4.0 | 26.0 | 24.1 | 33.9 | ||||
| Madera | 6.7 | 4.6 | 6.8 | 44.4 | 47.1 | 78.1 | ||||
| Merced | 3.0 | 3.0 | 5.5 | 27.8 | 33.8 | 52.8 | ||||
| Placer | 2.4 | 2.9 | 3.5 | 25.5 | 24.2 | 28.6 | ||||
| Sacramento | 2.2 | 2.4 | 2.8 | 22.9 | 21.9 | 23.0 | ||||
| San Benito | 2.9 | 3.8 | 4.6 | r | 31.0 | 26.2 | 40.7 | |||
| San Joaquin | 2.7 | 2.9 | 4.1 | 24.4 | 24.5 | 24.8 | ||||
| Stanislaus | 3.0 | 3.2 | 4.0 | 24.2 | 23.1 | 26.0 | ||||
| Tulare | 3.9 | 4.3 | 6.2 | 29.6 | 26.8 | 38.8 | ||||
| Other Calif. Counties | ||||||||||
| Amador | 4.4 | 4.3 | 7.5 | 54.4 | 55.2 | 61.0 | ||||
| Butte | 3.3 | 2.9 | 4.2 | 42.0 | 29.3 | 36.2 | ||||
| Calaveras | 6.1 | 5.0 | 5.3 | 57.6 | 58.2 | 87.4 | ||||
| Del Norte | 4.9 | 8.1 | 11.5 | 127.0 | 128.3 | 126.4 | ||||
| El Dorado | 3.0 | 3.5 | 5.3 | 48.7 | 41.7 | 53.8 | ||||
| Humboldt | 2.9 | 3.4 | 4.8 | 31.7 | 33.9 | 54.2 | ||||
| Lake | 5.1 | 5.4 | 4.6 | 80.0 | 81.9 | 116.8 | ||||
| Mariposa | 4.6 | 6.0 | 10.4 | 31.0 | 100.7 | 105.5 | ||||
| Mendocino | 6.3 | 7.1 | 7.7 | r | 73.9 | 75.5 | 70.1 | |||
| Mono | 5.9 | 14.0 | NA | 126.3 | 115.2 | 131.4 | ||||
| Nevada | 3.8 | 3.9 | 5.1 | 29.5 | 34.8 | 47.2 | ||||
| Plumas | 8.3 | 9.5 | 8.4 | 127.5 | 124.6 | 125.8 | ||||
| Shasta | 4.2 | 4.4 | 7.6 | 36.7 | 41.9 | 55.7 | ||||
| Siskiyou | 6.0 | 6.1 | 7.9 | 47.9 | 51.3 | 79.1 | ||||
| Sutter | 2.2 | 2.3 | 3.8 | 26.3 | 26.9 | 38.9 | ||||
| Tehama | 5.4 | 6.7 | 6.4 | 51.5 | 73.7 | 53.8 | ||||
| Tuolumne | 4.7 | 6.6 | 6.1 | 69.5 | 67.2 | 43.9 | ||||
| Yolo | 2.9 | 3.0 | 3.1 | 25.7 | 24.6 | 24.9 | ||||
| Yuba | 3.0 | 2.5 | 4.2 | 27.8 | 25.4 | 25.4 | ||||
NA = not available
Source: C.A.R.