


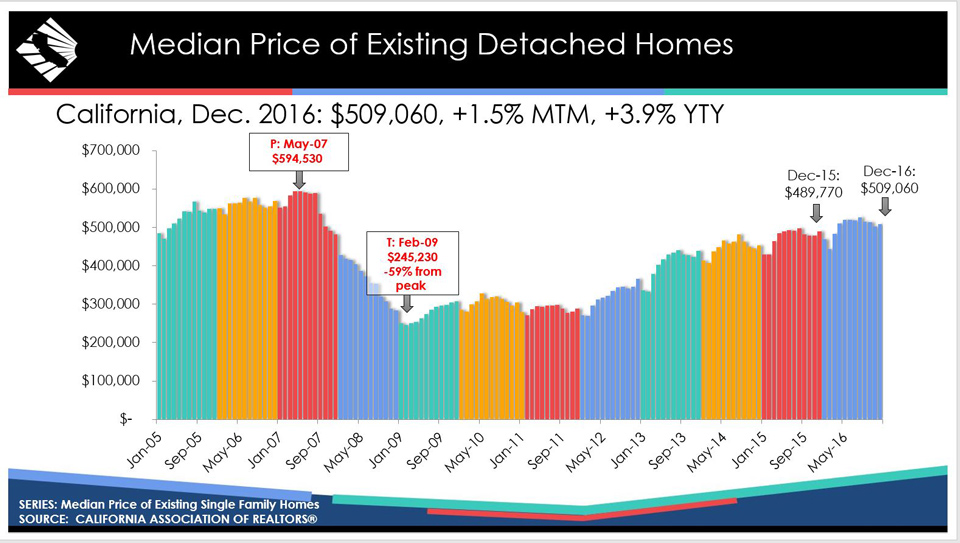
California Median Price of Existing Detached Homes for December 2016
Source: C.A.R.
California home price ends year on high note while sales moderate in December; housing market posts solid performance in 2016
- December’s statewide median home price was $509,060, up 1.5 percent from November and 3.9 percent from December 2015.
- Existing, single-family home sales totaled 411,230 in December on a seasonally adjusted annualized rate, down 7 percent from November and 0.6 percent from December 2015.
- Demand for homes continued to outstrip supply, causing the Unsold Inventory Index to decline to 2.6 months in December from 2.8 months in December 2015.
January 30, 2017 - LOS ANGELES – Despite strong headwinds of tight housing supplies and an affordability squeeze throughout much of 2016, California’s housing market ended the year on a positive note, posting a moderate sales pace and home price increases in December, the CALIFORNIA ASSOCIATION OF REALTORS® (C.A.R.) said today.
Closed escrow sales of existing, single-family detached homes in California totaled a seasonally adjusted annualized rate of 411,230 units in December, according to information collected by C.A.R. from more than 90 local REALTOR® associations and MLSs statewide. The statewide sales figure represents what would be the total number of homes sold during 2016 if sales maintained the December pace throughout the year. It is adjusted to account for seasonal factors that typically influence home sales.
The December figure was down 7 percent from the 442,320 level in November, and down 0.6 percent compared with home sales in December 2015 of a revised 413,700. Despite the declines, December’s sales were on par with the two-year average sales pace of 412,000 maintained since 2015. Home sales remained above the 400,000 pace for the ninth straight month.
For 2016 as a whole, a preliminary 416,250 single-family homes closed escrow in California, up 1.7 percent from 2015’s revised pace of 409,410.
“December’s sales decrease was expected, and was primarily due to unseasonably strong sales last month and December 2015, when new mortgage rules delayed sales that would have closed in November 2015 and pushed closings into December 2015,” said C.A.R. President Geoff McIntosh. “Despite a decline in sales in December, the strong performance in the last quarter of 2016 helped push annual sales above 2015’s pace. The last quarter of 2016, in fact, was the best quarter we’ve had since the fourth quarter of 2012.”
The statewide median price increased for the first time since August and remained above the $500,000 mark for the ninth consecutive month. The median price of an existing, single-family detached California home rose 1.5 percent from a revised $501,710 in November to reach $509,060 in December.
December’s median price increased 3.9 percent from the revised $489,770 recorded in December 2015. California’s housing market experienced sold price growth throughout 2016, with the median price increasing 5.4 percent for the year as a whole to reach $502,250. The median sales price is the point at which half of homes sold for more and half sold for less; it is influenced by the types of homes selling, as well as a general change in values.
“While we had a decent fourth quarter performance, it by no means indicates that the market will be easy in the upcoming year,” said C.A.R. Senior Vice President and Chief Economist Leslie Appleton-Young. “Looking ahead, we expect plenty of headwinds in 2017, including rising interest rates, scarce housing inventory, and a persistent affordability crunch, along with many uncertainties in the policy arena to challenge the housing market.”
Other key points from C.A.R.’s December 2016 resale housing report include:
• Despite a modest decline in closed sales in December, housing supply shrank because of a significant drop in active listings compared with December 2015. C.A.R.’s Unsold Inventory Index, which indicates the number of months needed to sell the supply of homes on the market at the current sales rate, declined on both a monthly and annual basis. The index fell to 2.6 months in December from 3.1 months in November. The index stood at 2.8 months in December 2015.
• New statewide active listings continued to decline, falling 13.8 percent from November and 8.5 percent from December 2015.
• The median number of days it took to sell a single-family home rose from 29.7 days in November to 33 days in December but was down from 39.4 days in December 2015.
• C.A.R.’s sales-to-list price ratio* was 98.1 of listing prices statewide in December, 98.3 percent in November and 98 in December 2015.
• The average price per square foot** for an existing, single-family home statewide was $241 in December, $250 in November, and $232 in December 2015.
• San Francisco County had the highest price per square foot in December at $808/sq. ft., followed by San Mateo ($783/sq. ft.), and Santa Clara ($595/sq. ft.). Counties with the lowest price per square foot in December included Tehama ($126/sq. ft.), Tulare ($130/sq. ft.), and Kern ($130/sq. ft.).
• Mortgage rates surged in the last few weeks of 2016 to the highest level since mid-2014, with the 30-year, fixed-mortgage interest rate averaging 4.20 percent in December, up from 3.77 percent in November and 3.96 percent in December 2015, according to Freddie Mac. The five-year, adjustable-rate mortgage interest rates also rose in December to an average of 3.23 percent, up from 2.99 percent in November and 3.04 percent in December 2015.
Graphics (click links to open):
• December sales at-a-glance infographic.
• Calif. historical existing home sales.
• Share of sales by price range.
• Calif. historical price per square foot.
• Calif. historical median home price.
• Calif. historical unsold inventory index.
Note: The County MLS median price and sales data in the tables are generated from a survey of more than 90 associations of REALTORS® throughout the state, and represent statistics of existing single-family detached homes only. County sales data are not adjusted to account for seasonal factors that can influence home sales. Movements in sales prices should not be interpreted as changes in the cost of a standard home. The median price is where half sold for more and half sold for less; medians are more typical than average prices, which are skewed by a relatively small share of transactions at either the lower-end or the upper-end. Median prices can be influenced by changes in cost, as well as changes in the characteristics and the size of homes sold. The change in median prices should not be construed as actual price changes in specific homes.
*Sales-to-list price ratio is an indicator that reflects the negotiation power of home buyers and home sellers under current market conditions. The ratio is calculated by dividing the final sales price of a property by its last list price and is expressed as a percentage. A sales-to-list ratio with 100 percent or above suggests that the property sold for more than the list price, and a ratio below 100 percent indicates that the price sold below the asking price.
**Price per square foot is a measure commonly used by real estate agents and brokers to determine how much a square foot of space a buyer will pay for a property. It is calculated as the sale price of the home divided by the number of finished square feet. C.A.R. currently tracks price-per-square foot statistics for 39 counties.
Leading the way…® in California real estate for more than 110 years, the CALIFORNIA ASSOCIATION OF REALTORS® (www.car.org) is one of the largest state trade organizations in the United States with 185,000 members dedicated to the advancement of professionalism in real estate. C.A.R. is headquartered in Los Angeles.
December 2016 County Sales and Price Activity
(Regional and condo sales data not seasonally adjusted)
| December-16 | Median Sold Price of Existing Single-Family Homes | Sales | |||||||
| State/Region/County | Dec-16 | Nov-16 | Dec-15 | MTM% Chg | YTY% Chg | MTM% Chg | YTY% Chg | ||
| CA SFH (SAAR) | $509,060 | $501,710 | $489,770 | r | 1.5% | 3.9% | -7.0% | -0.6% | |
| CA Condo/Townhomes | $403,240 | $416,700 | $393,510 | r | -3.2% | 2.5% | -3.7% | -6.7% | |
| Los Angeles Metro Area | $463,380 | $461,540 | $448,930 | r | 0.4% | 3.2% | 3.4% | -1.4% | |
| Inland Empire | $320,970 | $317,720 | $300,130 | 1.0% | 6.9% | 0.7% | 2.4% | ||
| S.F. Bay Area | $775,820 | $809,150 | $729,690 | r | -4.1% | 6.3% | -13.4% | -12.8% | |
| S.F. Bay Area | |||||||||
| Alameda | $755,000 | $800,000 | $731,500 | r | -5.6% | 3.2% | -13.8% | -13.3% | |
| Contra Costa | $550,000 | $569,000 | $500,000 | r | -3.3% | 10.0% | -8.7% | -7.8% | |
| Marin | $1,118,700 | $1,050,000 | $1,100,000 | r | 6.5% | 1.7% | -12.8% | -19.4% | |
| Napa | $605,000 | $637,500 | $595,500 | r | -5.1% | 1.6% | -7.0% | -10.6% | |
| San Francisco | $1,315,210 | $1,360,500 | $1,204,000 | r | -3.3% | 9.2% | -6.0% | -4.6% | |
| San Mateo | $1,332,500 | $1,216,750 | $1,194,000 | 9.5% | 11.6% | -15.3% | -10.1% | ||
| Santa Clara | $965,000 | $1,010,000 | $920,000 | -4.5% | 4.9% | -16.8% | -15.7% | ||
| Solano | $405,000 | $380,000 | $349,450 | r | 6.6% | 15.9% | -8.8% | -10.8% | |
| Sonoma | $585,000 | $578,000 | $549,000 | r | 1.2% | 6.6% | -24.7% | -23.9% | |
| Southern California | |||||||||
| Los Angeles | $519,280 | $483,830 | $502,750 | 7.3% | 3.3% | 7.9% | -3.1% | ||
| Orange | $745,000 | $734,500 | $700,000 | r | 1.4% | 6.4% | 1.8% | 1.8% | |
| Riverside | $360,000 | $352,500 | $341,000 | r | 2.1% | 5.6% | 4.1% | 5.5% | |
| San Bernardino | $253,460 | $253,140 | $234,080 | 0.1% | 8.3% | -4.7% | -2.5% | ||
| San Diego | $568,000 | $557,000 | $530,000 | r | 2.0% | 7.2% | -2.5% | -2.9% | |
| Ventura | $627,580 | $630,250 | $601,910 | -0.4% | 4.3% | -11.4% | -20.1% | ||
| Central Coast | |||||||||
| Monterey | $497,000 | $515,000 | $520,000 | -3.5% | -4.4% | 2.8% | 10.5% | ||
| San Luis Obispo | $559,000 | $560,000 | $549,000 | r | -0.2% | 1.8% | -9.5% | -8.9% | |
| Santa Barbara | $735,000 | $719,500 | $602,500 | r | 2.2% | 22.0% | -3.0% | 0.5% | |
| Santa Cruz | $805,000 | $795,000 | $703,940 | 1.3% | 14.4% | -13.1% | -19.2% | ||
| Central Valley | |||||||||
| Fresno | $238,220 | $238,000 | $225,000 | r | 0.1% | 5.9% | 15.3% | 10.9% | |
| Glenn | $197,500 | $215,000 | $174,500 | r | -8.1% | 13.2% | 15.4% | 7.1% | |
| Kern | $220,000 | $225,000 | $215,000 | -2.2% | 2.3% | -0.9% | -14.7% | ||
| Kings | $215,000 | $210,000 | $200,000 | r | 2.4% | 7.5% | -3.4% | -9.6% | |
| Madera | $227,950 | $212,950 | $228,500 | r | 7.0% | -0.2% | 47.8% | 41.7% | |
| Merced | $235,000 | $215,000 | $211,000 | r | 9.3% | 11.4% | -12.8% | -11.2% | |
| Placer | $425,000 | $427,000 | $395,000 | r | -0.5% | 7.6% | -1.6% | 0.4% | |
| Sacramento | $314,940 | $325,000 | $296,500 | r | -3.1% | 6.2% | 3.2% | -4.8% | |
| San Benito | $475,000 | $503,090 | $452,500 | -5.6% | 5.0% | -29.6% | -9.5% | ||
| San Joaquin | $326,750 | $319,000 | $285,000 | r | 2.4% | 14.6% | 1.2% | -2.6% | |
| Stanislaus | $275,000 | $271,500 | $249,950 | r | 1.3% | 10.0% | 3.6% | -6.1% | |
| Tulare | $202,000 | $217,500 | $195,500 | r | -7.1% | 3.3% | 22.0% | 4.2% | |
| Other Calif. Counties | |||||||||
| Amador | $272,500 | $275,000 | $275,000 | -0.9% | -0.9% | -2.2% | 10.0% | ||
| Butte | $294,250 | $279,000 | $256,500 | r | 5.5% | 14.7% | 9.7% | 4.9% | |
| Calaveras | $288,000 | $268,500 | $270,000 | r | 7.3% | 6.7% | 28.2% | 5.3% | |
| Del Norte | $232,250 | $225,000 | $195,000 | r | 3.2% | 19.1% | -42.9% | -23.8% | |
| El Dorado | $434,500 | $442,000 | $413,750 | r | -1.7% | 5.0% | 14.8% | 13.3% | |
| Humboldt | $295,000 | $289,000 | $285,000 | r | 2.1% | 3.5% | -11.8% | -9.5% | |
| Lake | $210,000 | $259,000 | $218,000 | r | -18.9% | -3.7% | 9.9% | -18.8% | |
| Mariposa | $227,000 | $258,250 | $224,900 | r | -12.1% | 0.9% | 42.9% | 100.0% | |
| Mendocino | $366,000 | $371,500 | $360,000 | r | -1.5% | 1.7% | -2.1% | -20.3% | |
| Mono | $528,500 | $618,750 | $995,000 | r | -14.6% | -46.9% | -22.2% | 40.0% | |
| Nevada | $355,000 | $358,500 | $350,000 | r | -1.0% | 1.4% | -25.0% | -19.8% | |
| Plumas | $230,000 | $266,000 | $264,500 | r | -13.5% | -13.0% | -3.2% | 50.0% | |
| Shasta | $235,750 | $250,000 | $234,570 | r | -5.7% | 0.5% | 15.4% | 16.4% | |
| Siskiyou | $255,000 | $183,000 | $141,750 | r | 39.3% | 79.9% | -20.5% | -3.1% | |
| Sutter | $253,500 | $259,000 | $222,000 | r | -2.1% | 14.2% | -4.0% | 18.0% | |
| Tehama | $204,250 | $235,000 | $185,000 | r | -13.1% | 10.4% | -12.8% | -30.6% | |
| Tuolumne | $253,380 | $260,000 | $229,000 | r | -2.5% | 10.6% | -7.9% | -6.7% | |
| Yolo | $405,000 | $375,000 | $354,750 | r | 8.0% | 14.2% | 14.9% | -6.1% | |
| Yuba | $247,450 | $265,000 | $233,000 | r | -6.6% | 6.2% | -5.6% | -6.8% | |
December 2016 County Unsold Inventory and Time on Market
(Regional and condo sales data not seasonally adjusted)
| December-16 | Unsold Inventory Index | Median Time on Market | ||||||||
| State/Region/County | Dec-16 | Nov-16 | Dec-15 | Dec-16 | Nov-16 | Dec-15 | ||||
| CA SFH (SAAR) | 2.6 | 3.1 | 2.8 | 33.0 | 29.7 | 39.4 | r | |||
| CA Condo/Townhomes | 2.2 | 2.6 | 2.3 | 29.6 | 28.5 | 37.4 | r | |||
| Los Angeles Metropolitan Area | 3.0 | 3.6 | 3.3 | 42.9 | 42.2 | 54.5 | r | |||
| Inland Empire | 3.6 | 4.1 | 4.1 | 46.7 | 46.2 | 57.3 | ||||
| S.F. Bay Area | 1.5 | 1.9 | 1.4 | 26.7 | 25.3 | 26.0 | r | |||
| S.F. Bay Area | ||||||||||
| Alameda | 1.2 | 1.5 | 1.1 | 21.9 | 20.2 | 20.2 | ||||
| Contra Costa | 1.6 | 1.9 | 1.5 | 23.9 | 22.3 | 22.9 | ||||
| Marin | 1.9 | 2.5 | 1.4 | 46.2 | 46.6 | 40.7 | r | |||
| Napa | 3.6 | 4.1 | 3.1 | r | 51.3 | 54.0 | 56.7 | r | ||
| San Francisco | 0.9 | 1.7 | 0.9 | 31.0 | 26.4 | 27.2 | ||||
| San Mateo | 1.1 | 1.6 | 1.2 | r | 21.7 | 21.0 | 20.9 | |||
| Santa Clara | 1.2 | 1.6 | 1.1 | r | 23.3 | 22.8 | 23.2 | |||
| Solano | 2.1 | 2.4 | 2.2 | r | 48.6 | 42.9 | 46.1 | r | ||
| Sonoma | 2.5 | 2.3 | 2.1 | 50.1 | 52.3 | 55.3 | r | |||
| Southern California | ||||||||||
| Los Angeles | 2.6 | 3.3 | 2.8 | 35.1 | 33.3 | 48.4 | r | |||
| Orange | 2.6 | 3.3 | 2.8 | 47.2 | 47.7 | 66.0 | ||||
| Riverside | 3.8 | 4.3 | 4.4 | 47.2 | 45.9 | 61.0 | ||||
| San Bernardino | 3.2 | 3.6 | 3.5 | 45.7 | 46.7 | 51.9 | ||||
| San Diego | 2.6 | 3.0 | 2.7 | 26.6 | 24.3 | 25.6 | ||||
| Ventura | 3.3 | 3.8 | 3.0 | 65.9 | 57.9 | 61.1 | ||||
| Central Coast | ||||||||||
| Monterey | 3.5 | 4.4 | 4.0 | r | 32.2 | 33.8 | 44.3 | |||
| San Luis Obispo | 3.4 | 3.5 | 3.3 | 36.6 | 46.4 | 42.3 | ||||
| Santa Barbara | 4.0 | 4.5 | 3.7 | r | 32.5 | 32.7 | 49.0 | r | ||
| Santa Cruz | 2.4 | 2.9 | 1.9 | r | 31.0 | 28.0 | 32.0 | |||
| Central Valley | ||||||||||
| Fresno | 3.0 | 4.0 | 3.9 | 27.4 | 25.8 | 33.1 | ||||
| Glenn | 4.9 | 5.8 | 4.7 | 52.8 | 52.8 | 31.0 | ||||
| Kern | 3.6 | 4.0 | 3.5 | 29.7 | 29.7 | 31.5 | r | |||
| Kings | 2.8 | 3.1 | 2.6 | 25.2 | 26.0 | 27.7 | ||||
| Madera | 4.1 | 6.7 | 7.8 | 54.2 | 44.4 | 56.8 | ||||
| Merced | 3.1 | 3.0 | 3.5 | 29.1 | 27.8 | 38.6 | ||||
| Placer | 1.8 | 2.4 | 2.1 | 27.0 | 25.5 | 28.9 | ||||
| Sacramento | 1.6 | 2.2 | 1.7 | 24.0 | 22.9 | 24.8 | ||||
| San Benito | 3.7 | 2.9 | 3.5 | r | 31.0 | 31.0 | 28.7 | |||
| San Joaquin | 2.2 | 2.7 | 2.3 | 26.5 | 24.4 | 26.2 | ||||
| Stanislaus | 2.4 | 3.0 | 2.4 | 26.8 | 24.2 | 27.4 | ||||
| Tulare | 3.2 | 3.9 | 3.3 | 28.1 | 29.6 | 37.8 | ||||
| Other Calif. Counties | ||||||||||
| Amador | 3.9 | 4.4 | 4.4 | 75.5 | 54.4 | 56.4 | ||||
| Butte | 2.4 | 3.3 | 2.9 | 26.2 | 42.0 | 42.0 | ||||
| Calaveras | 4.3 | 6.1 | 4.4 | 46.4 | 57.6 | 74.1 | ||||
| Del Norte | 7.1 | 4.9 | 6.1 | 110.3 | 127.0 | 122.3 | ||||
| El Dorado | 2.6 | 3.0 | 3.6 | 54.4 | 48.7 | 55.0 | ||||
| Humboldt | 2.8 | 2.9 | 2.9 | 29.2 | 31.7 | 39.5 | ||||
| Lake | 3.9 | 5.1 | 3.4 | 91.0 | 80.0 | 95.1 | ||||
| Mariposa | 3.1 | 4.6 | 9.3 | 100.7 | 31.0 | 125.8 | ||||
| Mendocino | 5.5 | 6.3 | 4.8 | r | 73.7 | 73.9 | 75.5 | r | ||
| Mono | 6.8 | 5.9 | NA | 129.7 | 126.3 | 121.0 | ||||
| Nevada | 4.1 | 3.8 | 3.7 | 26.0 | 29.5 | 46.4 | ||||
| Plumas | 6.7 | 8.3 | 10.4 | 128.3 | 127.5 | 130.7 | ||||
| Shasta | 3.4 | 4.2 | 4.6 | 28.7 | 36.7 | 50.2 | ||||
| Siskiyou | 6.8 | 6.0 | 7.0 | 49.1 | 47.9 | 75.5 | ||||
| Sutter | 2.1 | 2.2 | 3.3 | 29.2 | 26.3 | 41.0 | ||||
| Tehama | 5.4 | 5.4 | 3.1 | 80.3 | 51.5 | 53.2 | ||||
| Tuolumne | 4.3 | 4.7 | 4.2 | 52.8 | 69.5 | 82.8 | ||||
| Yolo | 1.8 | 2.9 | 1.9 | 22.4 | 25.7 | 25.1 | ||||
| Yuba | 2.8 | 3.0 | 2.6 | 23.9 | 27.8 | 28.1 | ||||
r = revised
NA = not available
Source: C.A.R.