


Statistics
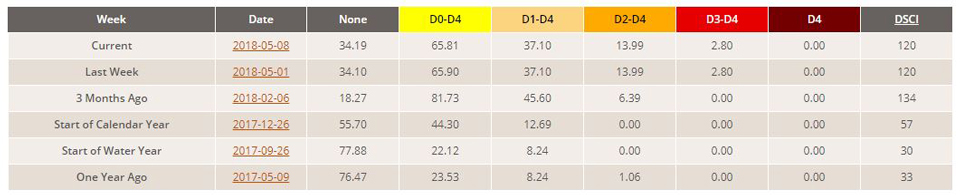
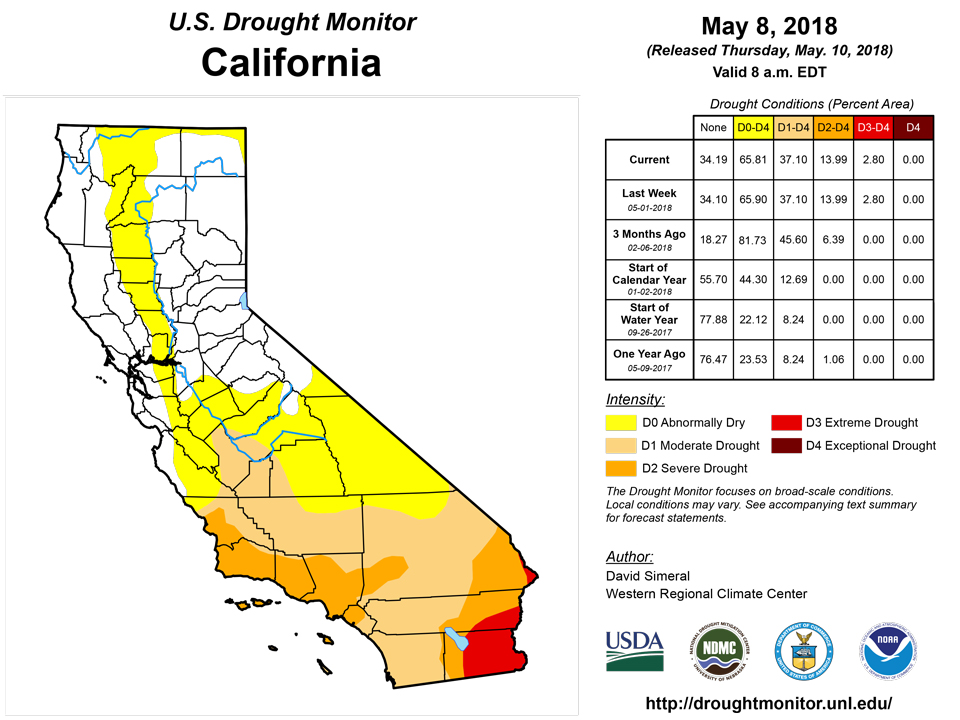
California and National Drought Summary for May 8, 2018
Summary
May 10, 2018 - This U.S. Drought Monitor week saw scattered showers and thunderstorms across portions of the South, southern and central Plains, Midwest, and Northeast. This week’s storm activity led to targeted improvements in drought-related conditions in portions of Texas, Kansas, Iowa, and Florida while conditions deteriorated in parts of the Desert Southwest, northern Plains, and the Midwest. Across most of the continental U.S., average temperatures for the week were well above normal including some recording-breaking heat last week in parts of the Mid-Atlantic and Northeast where temperatures soared into the 90s. In the southern and central Plains, concerns continue with regard to the condition of the winter wheat crop with the USDA World Agricultural Outlook Board reporting 50% of the Kansas winter wheat crop in poor to very poor condition while Oklahoma and Texas are worse off at 68% and 60%, respectively. In the Southwest, a very dry winter and spring season are taking a toll on the vegetation with the USDA reporting 95% of Arizona pasture and rangeland in poor to very poor condition with New Mexico at 60%.
Northeast
No changes were made in the region on this week’s map. During the past week, scattered showers and thunderstorms impacted parts of the region with the heaviest rainfall accumulations centered on West Virginia (2-to-4 inches) as well as isolated areas of northern Maine that saw 2-to-3 inches. Average temperatures for the week were 2-to-10 degrees above normal including record-breaking daily high temperatures (90 and 93°F) at New York’s LaGuardia Airport on May 2nd and 3rd. Looking at the NOAA National Centers of Environmental Information (NCEI) climatological rankings, the Northeast region experienced its 9th coldest and 29th wettest April on record (period of record: 1895–2018).
Southeast
On this week’s map, conditions remained status quo in northern portions of the region while short-term precipitation deficits during the past 30 days led to expansion of areas of Abnormally Dry (D0) in southern Alabama and in northwestern Florida near the Apalachicola River. Further south in east-central Florida, locally heavy rainfall accumulations (2-to-4 inches) were observed this week in both Indian River and Orange counties leading to improvements in areas of Abnormally Dry (D0) and Moderate Drought (D1). In contrast, much of west-central Florida largely missed out on precipitation this week leading to expansion of areas of Moderate Drought (D1) in Sarasota County where rainfall deficits are in the 2-to-4 inch range for the past 60 days. In northeastern Georgia, areas of Abnormally Dry (D0) and Moderate Drought (D1) expanded slightly in response to short-term precipitation deficits during the last 60-day period and low streamflows. For the week, most of the region was dry, and average temperatures were near normal.
South
On this week’s map, improvements were made across parts of Texas (central, southern, western) where scattered showers and thunderstorms late last week and into the weekend produced locally heavily rainfall accumulations ranging from 2-to-5 inches while the drought-stricken Panhandle region remained hot and dry leading to slight expansion of areas of Extreme Drought (D3) and Exceptional Drought (D4). According to the May 7th USDA Texas Crop Progress and Condition report, winter wheat in the north-central Plains remained in poor condition. In Oklahoma, heavy rainfall (2-to-4 inches) was observed in parts of the state including southwestern, south-central, and east-central, leading to some targeted minor improvements along the sharp gradient between drought and drought-free areas. Elsewhere in the region, northwestern Arkansas and portions of northern Mississippi received rain during the past week with accumulations ranging from 2-to-3 inches. Temperatures were above normal across most of the region with the largest positive anomalies in western Oklahoma and the Texas Panhandle where maximum daily temperatures reached the mid-90s.
Midwest
On this week’s map, areas of Abnormally Dry (D0) and Moderate Drought (D1) were reduced in southwestern Iowa in response to rainfall accumulations of 2-to-3 inches. In northeastern Iowa and southern Wisconsin, 3-to-5 inches of rain fell this week helping to improve soil moisture and streamflow conditions. In contrast, areas of Abnormally Dry (D0) were introduced to portions of Illinois, Minnesota, and Missouri where rainfall has been below normal during the past 60 days – with areas of below normal surface and root zone soil moisture appearing on the latest satellite-based NASA GRACE-based drought products (http://nasagrace.unl.edu). For the week, average temperatures were 2-to-10 degrees above normal with maximum daily temperatures exceeding 80°F. Looking at the month of April, the Upper Midwest region experienced its coldest April on record, according to NOAA NCEI.
High Plains
On this week’s map, locally heavy rains (3-to-5 inches) impacted isolated areas of northeastern Kansas leading to reduction in areas of Moderate Drought (D1). Meanwhile, short-term precipitation deficits during the past 30 to 60 days led to expansion of areas of Abnormally Dry (D0) in eastern North Dakota where local pastures are in need of rainfall and some cattle producers are running low on feed. According to the May 7th USDA NASS North Dakota Crop Progress and Condition Report, pasture and range conditions were reported as 5% very poor and 22% poor. In southeastern Nebraska and the eastern half of Kansas, dryness during the past 30 to 60 days has led to low streamflows especially in Kansas where many rivers and creeks are currently flowing well below normal levels. For the week, the region was warm and dry (with the exception of portions of northeastern Kansas, northeastern Colorado, and southeastern Wyoming) with temperatures well above normal and maximum daily temperatures exceeding 80°F.
West
On this week’s map, areas of Extreme Drought (D3) expanded in north-central Arizona and central New Mexico. In north-central Arizona, precipitation for the current Water Year (October to present) is the driest on record or falling within the bottom 10th percentile, according to the Western Regional Climate Center’s WestWide Drought Tracker. Looking at statewide precipitation rankings, Arizona experienced its 3rd driest October-through-April period on record while New Mexico had its 10th driest, according to the NOAA NCEI. Elsewhere in the region, areas of Exceptional Drought (D4) expanded in southwestern Colorado where precipitation totals for the current Water Year at a number of NRCS SNOTEL stations (in the San Juan Mountains) are at record low levels with well below normal runoff forecasted. Overall, the West was hot and dry during the past week – with some light shower activity (generally less than 1 inch) observed in the Intermountain West, central and northern Rockies, and portions of the Pacific Northwest. Average temperatures were well above normal in the northern half of the region while the southern half was near normal.
Alaska, Hawaii, and Puerto Rico
No changes were made on this week’s map in Alaska, Hawaii, or Puerto Rico. In the Hawaiian Islands, rainfall accumulations were light across the islands with 7-day storm totals of less than 1.5 inch observed on Kauai, Oahu, Maui, and the Big Island. Average temperatures for the week were 2-to-4 degrees above normal, while Kauai was 3-to-4 degrees below normal. In Alaska, cool and generally dry conditions prevailed across most of the state with the exception of Prince William Sound and portions of Southeast Alaska that received locally heavy rainfall accumulations ranging from 4-to-7 inches during the past week. For the past 30-day period, precipitation was above normal across western Alaska, the Aleutians, Southcentral, and Southeast. Average temperatures were above normal along the North Slope and Aleutians but below normal across portions of the Interior, Southcentral, and Southeast Alaska. In Puerto Rico, heavy rainfall accumulations were observed in the eastern (3-to-8 inches) portions while southern portions were dry during the past week.
Looking Ahead
The NWS WPC 7-Day Quantitative Precipitation Forecast (QPF) calls for moderate-to-heavy accumulations ranging from 2-to-3 inches across portions of the northern Rockies (south-central Montana, Wyoming), northern portions of the Midwest and southern portions of the Northeast, and southern Florida. Drought-stricken areas of the Desert Southwest are forecast to remain in a dry pattern as well as much of the Southern Plains, South, and Southeast. The CPC 6–10-day outlook calls for a high probability of above-normal temperatures across all of the continental U.S. with the exception of southern California and southwestern Arizona where temperatures are expected to be near normal. In terms of precipitation, above normal amounts are expected in the Great Basin, Intermountain West, portions of the southern Rockies, Southern and Central Plains, and most of the eastern U.S. while below normal precipitation is forecast for the Pacific Northwest and northern California.
Author(s):
David Simeral, Western Regional Climate Center
Dryness Categories
D0 Abnormally Dry—used for areas showing dryness but not yet in drought, or for areas recovering from drought.
Drought Intensity Categories
D1 Moderate Drought
D2 Severe Drought
D3 Extreme Drought
D4 Exceptional Drought
Drought or Dryness Types
S Short-Term, typically less than 6 months (e.g. agricultural, grasslands)
L Long-Term, typically greater than 6 months (e.g. hydrologic, ecologic)
Source: National Drought Mitigation Center
