


California and National Drought Summary for February 9, 2016
Summary
From February 2-3, a major low pressure system moved from the central Great Plains northeastward across the Great Lakes region and southern Ontario, accompanied by a variety of hazardous weather conditions to the central and eastern contiguous U.S. These hazards included heavy snowfall and blizzard conditions generally to areas north and west of the storm track, and severe weather to the Southeast. Straight-line and tornadic winds were responsible for most of the severe weather damage. Over the weekend, an area of low pressure developed off the Southeast Coast, accompanied by heavy rain over coastal areas, including most of Florida. This ocean storm tracked to the northeast, well off the Atlantic Coast, bringing heavy snow (generally 6-12 inches) to New England and eastern Long Island, NY. Some locations on Cape Cod also experienced high winds and blizzard conditions, with preliminary reports indicating peak wind gusts near 65 mph in Nantucket.Alaska, Hawaii, and Puerto Rico
Dry conditions continue across most of Hawaii. A cold front pushed across the islands during the weekend, bringing beneficial rainfall to north- and northeast-facing slopes of Maui County and the Big Island, but deficits for the year remain high. Changes made to the Hawaiian depiction this week included the addition of moderate drought (D1) across the western halves of Molokai and Lanai, and the expansion of D1 coverage over the southwestern side of the Big Island, farther up the slopes of Mauna Loa. These alterations were guided by local expertise and Vegetation Health Index (VHI) data. No adjustments to the depiction were deemed necessary in either Alaska or Puerto Rico this week.The Far West
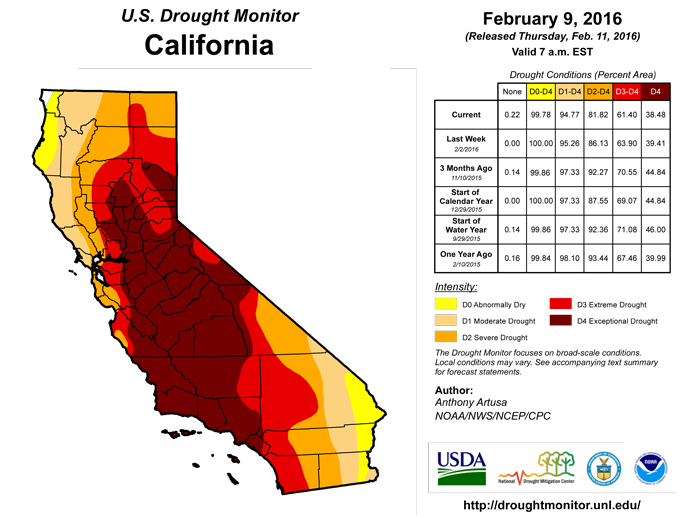
Reservoir storage and Snow Water Content (SWC) data played a large role in the revisions made this week to the USDM map in northern California and southern Oregon. Following is a brief tally of the Percent of Capacity (PoC), and the Percent of Historical Average (PoHA) values for four key reservoir sites in northern California, as given by the State of California’s Department of Water Resources (February 9th): Trinity Lake (PoC 30 percent, PoHA 42 percent), Shasta (55 percent and 79 percent, respectively), Lake Oroville (47 percent and 70 percent, respectively), and Folsom Lake (62 percent and 117 percent, respectively). The Department of Water Resources also provides a Percent of April 1 average Snowpack and the Percent of Normal Snowpack for this date (February 10th), for the Northern Sierra/Trinity region (79 percent and 108 percent, respectively) and for the Central Sierra region (74 percent and 103 percent, respectively). As of February 10th, SNOTEL basin-average SWC values in the California Sierras range from 90-125 percent of average. SWC values in southern Oregon appear to be somewhat greater, ranging from 125-150 percent of average. The Northern Sierra 8-station precipitation index for Water Year 2016 (updated February 5th) shows the average value of this index is 8.4 inches in December, and 9.0 inches in January. For Water Year 2016, however, the December index value is 11.8 inches, and the January index value is 16.1 inches, both significantly above the long-term monthly averages.Despite heavy rainfall in January, an above-average snowpack and rising reservoirs in many areas, the California State Water Resources Control Board recently approved an 8-month extension of existing drought-related emergency regulations. This is a reminder that although El Nino-related precipitation has been bountiful so far this winter, the drought situation in California remains very serious. Reservoir storage generally remains below-average and very significant groundwater shortages continue. There are also serious problems with tree mortality. The USDA estimates 29 million trees are already dead, and a Stanford group estimates another 29 million trees are showing significant stress. Given these various factors, it will take quite a while for improvements in the short-term to chip away at large, multi-year precipitation deficits.
Adjustments were made to the drought depiction this week in northern California and southern Oregon based on a wide variety of drought indicators and (mainly hydrological) feedback from drought experts across the region. Indicators used from the Western Regional Climate Center’s WestWide Drought Tracker (WWDT) included the Standardized Precipitation Index (SPI) and the Standardized Precipitation Evapo-transpiration Index (SPEI) at various time-scales, and the Palmer Drought Severity Index (PDSI). Current stream flows from the U.S. Geological Survey (USGS), Percent of Normal Precipitation (PNP) values from both ACIS and AHPS, CPC’s drought blends (short-term, long-term, and “worst-case”), and as noted above, SWC and reservoir information. Feedback from drought experts in California and Oregon played a key role in determining the modifications made to this week’s U.S. Drought Monitor.
In northwestern California, the D0, D1, and D2 contours were adjusted slightly eastward. Moderate drought (D1) was extended southward as far as Sonoma and Marin Counties. The D1/D2 boundary (separating moderate from severe drought) was moved slightly to the east, to central Siskiyou County, and eastern Trinity County. Extreme drought (D3) was eliminated from eastern and northwestern Modoc County, and exceptional drought (D4) was trimmed out of Lassen County. In southern Oregon, the D0, D1, and D2 contours were shifted slightly eastward. The D3 in southern Klamath and southern Lake Counties was eliminated. In northeastern Oregon, improved conditions warranted a one-category upgrade for Grant County, from D2 to D1.
The Great Plains and Upper Mississippi Valley
The primary revisions made to the drought depiction this week were in Texas. Most of the state has been drying out the last 30-days, with only two areas receiving more than a half-inch of precipitation. According to the Advanced Hydrologic Prediction Service (AHPS), far eastern Texas received moderate to heavy precipitation (0.5-3.0 inches), and the Trans-Pecos/western Edwards Plateau region generally received between 0.5-1.0 inch. However, many locations around the Abilene/San Angelo area have yet to receive measurable precipitation in 2016. Elsewhere, plant stress and elevated wildfire danger signaled either the expansion of, or introduction of, D0. In particular, deep South Texas has had very low dew points and strong winds. Topsoil moisture is rated by the U.S. Department of Agriculture (USDA) as very short to short. The additions rendered to the USDM map were guided by 1-4 month Standardized Precipitation Index (SPI) blends.Small changes were also made to the depiction in northwestern Kansas and northeastern Colorado. The eastern portion of the D0 band (straddling the state border) was removed, due to somewhat improved conditions. Abnormal dryness (D0) was retained in Washington and part of Kit Carson Counties in northeastern Colorado, based primarily on SPI and soil moisture considerations.
An area to watch over the next few weeks is northeastern Oklahoma and northwestern Arkansas. This region has been quite dry during the past 30-days, with less than 0.10-inch of precipitation reported. A few counties (such as Franklin and Polk in Arkansas) have issued bans against outdoor burning. Dry spells are not uncommon during the winter, and it is noteworthy that this particular area received 10-14 inches of precipitation in late December.
The Northeast, mid-Atlantic, and Great Lakes
Precipitation amounts over the past 2 weeks have been mixed across this area. At this time of year, normal precipitation is about 0.5-1.0 inch per week. Most areas reported near- to below-normal precipitation during this period, except the southern New England coast, eastern Long Island, NY, and the central coast of Maine, where Departure from Normal Precipitation (DNP) values range from 0.5-3.0 inches above normal. The largest departures (2-3 inches above normal) were noted across Cape Cod. DNPs in eastern West Virginia, far western Maryland, and southwestern Pennsylvania range from 0.5-2.0 inches below normal, which supports the retention of the abnormal dryness (D0) in that area.The drought depiction was adjusted in Vermont. The areas of D0 in upstate New York and northern New England were connected through Orange and Washington Counties in Vermont, based on continuing dryness. In southern New England, the short-term impact designation “S” was removed from the depiction, as most impacts are now at time ranges longer than 3-months. In Lower Michigan, the residual D0 patch was removed, as indications do not appear to justify it at this time.
The Rockies and Intermountain region
In central Nevada, some improvements seemed warranted. Using some of the same tools and indicators noted further down for California and Oregon, a one-category improvement was made to parts of northern Nye, Eureka, Lander, southwestern parts of Elko, and western White Pine Counties. No adjustments were made to the western counties of Nevada, as it takes time for the short-term gains in moisture to have a significant impact on long-term deficits. In southwestern Idaho, snowpack has nearly reached median peak annual values for the period of record. One-category improvements (from D1 to D0) were made in the Weiser, Bruneau, Salmon Falls, Oakley, and Raft basins, yet not to the Owyhee basin. Despite good snowpack, there is a significant lack of reservoir storage. In addition, for a large, low-elevation, high desert basin, a good snowpack doesn’t necessarily translate into adequate runoff.The Southeast
Much of southeastern Georgia received heavy rain (2-6 inches) during the past week. This precipitation, in addition to the 60-day Percent of Normal Precipitation (PNP), led to the removal of nearly all of the D0 area, with the exception of southern Clinch and southern Ware Counties. The remainder of the Southeast remains drought free, as precipitation has been more than adequate in many areas. The North Carolina Drought Group notes widespread rainfall during the last 7-days, and stream flows generally running from near- to much above-normal. Groundwater levels are near to above-normal, and lake levels are good.Looking Ahead
During February 11-15, a half-inch or less of precipitation (liquid equivalent) is forecast for far northwestern California and the western margin of the drought region in Oregon. One to two inches of precipitation is anticipated across northern Idaho and northeastern Oregon. Unfortunately, much heavier amounts of precipitation (3-7 inches) are predicted for parts of the Pacific Northwest which are no longer in drought. Precipitation amounts of a half-inch or less are predicted for the Dakotas and most of the Mississippi Valley, with perhaps an inch for the Ark-La-Tex region, and for downwind areas of the Lower Great Lakes region.During the ensuing 5 days (February 16-20), the projected precipitation pattern generally favors above-median precipitation from the Pacific Northwest and northern Rockies eastward across North Dakota, and continuing eastward and southeastward across the Great Lakes region, the Ohio and upper Tennessee Valleys, Appalachians, and Atlantic Coast states from Maine to South Carolina. Below-median precipitation is favored from California and the Southwest eastward across central and southern sections of both the Rockies and Great Plains, most of the Middle and Lower Mississippi Valley, and the Gulf Coast states including all of Florida. This pattern is what would be expected of a La Nina winter, not an El Nino winter. At any rate, some drought relief is at least favored across the northern U.S. during this period, but this is not the case for places like (most of) California, the Southwest, and Texas. Dryness is rapidly expanding across Texas, and some degradation in the drought depiction will probably be needed next week.
Author(s):
Anthony Artusa, NOAA/NWS/NCEP/CPC
Dryness Categories
D0 ... Abnormally Dry ... used for areas showing dryness but not yet in drought, or for areas recovering from drought.Drought Intensity Categories
D1 ... Moderate DroughtD2 ... Severe Drought
D3 ... Extreme Drought
D4 ... Exceptional Drought
Drought or Dryness Types
S ... Short-Term, typically <6 months (e.g. agricultural, grasslands)L ... Long-Term, typically >6 months (e.g. hydrology, ecology)
Source: National Drought Mitigation Center

