


May 25, 2016 - By Rebecca Lindsey, Emily Greenhalgh - Most of the continental United States is facing elevated chances of well above average summer temperatures, according to the latest outlook from NOAA’s Climate Prediction Center.
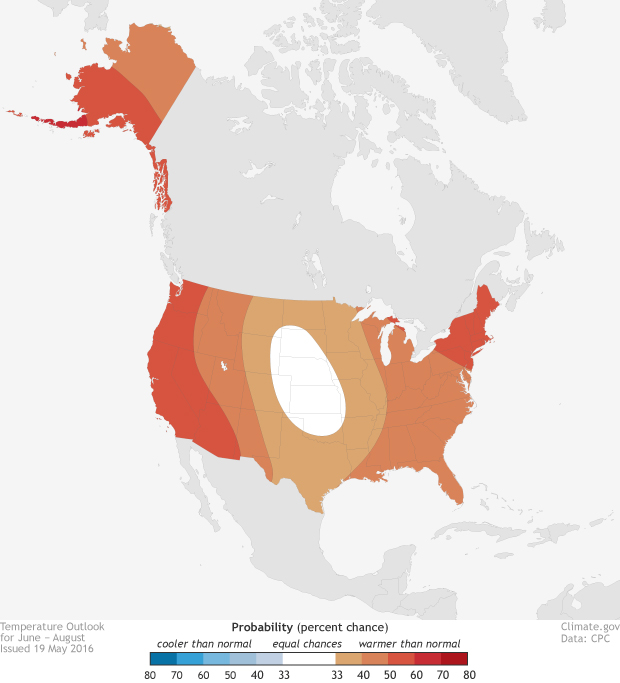
Colored areas on the map at right show which parts of the country have the highest odds (darkest red) for well above average warmth for the June-August period. For the seasonal forecasts, “well above average” means temperatures in the warmest third of all summers in the current climatological record (1981-2010). (Larger versions as well as precipitation maps are available via links below image to the right. A separate forecast discussion for Hawaii is available here.)
Nationwide, Alaska’s Aleutian Islands have the highest chances of an unusually warm summer, with probabilities between 60-70 percent. For the contiguous United States (i.e, the “Lower 48”), the chances for top-tier warmth are greatest in the West and the Northeast (50-60 percent), and smallest in the heart of the Great Plains, where the odds of well above average temperatures are the same as the odds of near-average or well below average temperatures (33 percent each).
(For math fans, a more detailed discussion of forecast probabilities is available at the end of the post.)
Darker colors mean greater chances of a hot summer, not how much hotter it’s projected to be. In other words, we’re not predicting that summer temperatures in Maine will be farther above average than temperatures in Florida; we’re predicting that the chances for an unusually hot summer are greater in Maine than they are in Florida.
Although the tropical Pacific appears to be in the middle of a transition between El Niño and La Niña, neither phase of ENSO has a significant influence on summer climate. Instead, the summer outlook is more influenced by short- and long-term ocean and atmospheric trends as well as mid-latitude sea surface temperatures in the Pacific and Atlantic Oceans.
For public health and welfare agencies or employers with outdoor laborers, summer temperature outlooks can provide advance warning of an elevated risk of dangerous summer heat. As part of the interagency National Integrated Heat Health Information System (NIHHIS), NOAA the CDC, and many other partners are providing quick online access to temperature outlooks and other heat health information and tools. NIHHIS is built on the U.S. Climate Resilience Toolkit, an interagency website devoted to helping U.S. communities and businesses become more resilient to climate variability and change.
Fun for math fans
NOAA’s seasonal forecasts start with the assumption that for any random summer or winter, there are three possible climate outcomes--temperature or precipitation that is well above normal (upper third of the climatological record), near normal (middle third), or below normal (lower third)--and they are each equally likely. Together, all probabilities must add up to 100%, so the “default” probability for each outcome is 33.3%.The goal of the forecast is to estimate how the actual conditions in the weeks or months before the season--like the presence of El Niño--tilt the odds toward or away from “equal chances” for all categories. If models predict that the chances of well above average temperatures are 60%, then the chances for the other two outcomes (near-average and well below average temperatures) must be split between the remaining 40% (100-60=40).
How do we divvy up the remaining fraction? Physically speaking, it makes sense to say that if the odds have tilted toward one climate outcome (say, unusual warmth) by a given amount, they’ve tilted away from the opposite outcome by an equal amount. So, by convention, forecasters divvy up the remaining fraction by holding the chances for near-normal conditions at the “default” 33.3%, and subtracting it from the remainder. What’s left (6.7%) is the probability of the least favored category.
When the odds of one climate outcome are so high (70 percent or more) that the remaining fraction is smaller than 33.3 percent, forecasters set a minimum 3.3 percent chance for the opposite outcome, and give the larger portion of the remainder to the near-normal outcome. (Otherwise, the least favored category would wind up with a negative probability, which doesn’t make mathematical or physical sense.) The Climate Prediction Center has a chart showing all the possible combinations, and their own description of the forecast format.
Since only one color can be assigned to any location on the map, the most favored category decides the color, but the other categories are still possible. So, in this summer’s season outlook for the Northeast and the West Coast, for example, the full suite of probabilities is 50-60% chance of well above normal temperatures, 33.3% chance of near-normal temperatures, and 6.7-16.7% chance of well below normal temperatures.
Maps by NOAA Climate.gov team, based on data from the Climate Prediction Center. Monthly outlook maps in a variety of re-usable formats are available via the Data Snapshots section of Climate.gov.
Source: NOAA

