


Utah Ranks Highest for Employment Growth Rate
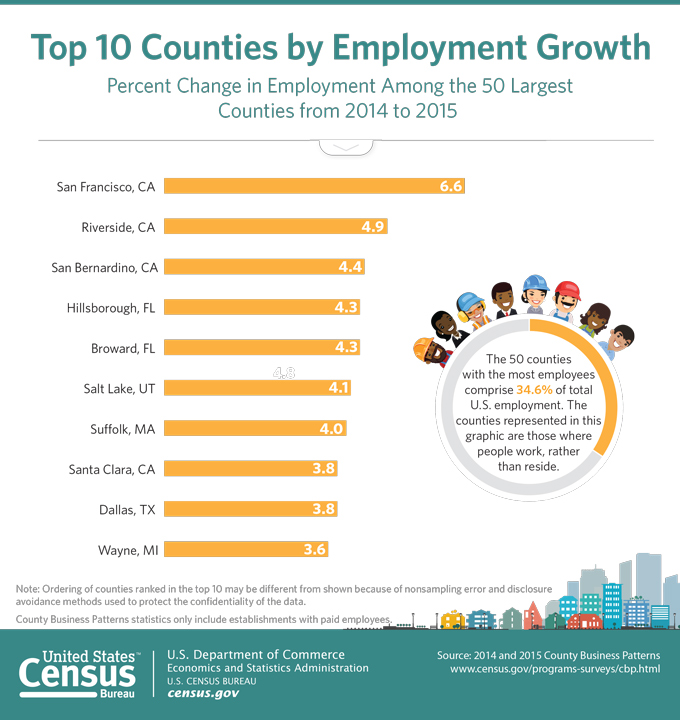
April 22, 2017 — San Francisco, Riverside and San Bernardino led the nation in annual employment growth among the top 50 U.S. counties with the most employees, according to new U.S. Census Bureau economic statistics released today. Overall, these 50 counties accounted for 34.6 percent of employment of all establishments defined by the North American Industry Classification System (NAICS).San Francisco County, first for the second year in a row, saw its employment grow 6.6 percent from 2014 to 2015, up 37,843 employees to 611,140 employees. The information sector (NAICS 51), up 13.3 percent to 64,223 employees, led growth in that county. San Francisco also led the top 10 largest counties in annual payroll increase, climbing 12.1 percent to $59.3 billion.
Riverside County saw its employment grow 4.9 percent, up 25,284 employees to 540,169 employees in 2015. San Bernardino County’s employment grew 4.4 percent, up 24,396 employees to 578,755 employees in 2015. Santa Clara County’s employment grew 3.8 percent, up 36,807 employees to 999,906 employees in 2015.
Transportation and Warehousing Sees Large Gains in Two California Counties
Some of the top counties saw the Transportation and Warehousing sector (NAICS 48-49) driving their growth. In Riverside County, transportation and warehousing employment increased 32.3 percent, up 6,865 employees and San Bernardino County saw an increase in employment of 16.2 percent, up 8,125 employees in this sector.Two other sectors had multiple appearances in the top 10 counties. Professional, Scientific, and Technical Services sector (NAICS 54) was the top sector in Suffolk County, Mass., with an employment increase of 12.0 percent. Hillsborough County, Fla., had an 8.8 percent increase in this sector. Retail Trade (NAICS 44-45) was the top sector in Salt Lake County, Utah, with an employment increase of 7.3 percent. It was also the top sector in Broward County, Fla., with an employment increase of 4.2 percent.
These latest data come from the 2015 County Business Patterns, which provides the only detailed annual information on the number of establishments, employees, and first quarter and annual payroll at the national, state, county, metropolitan, congressional district and five-digit ZIP code levels for nearly 1,200 industries.
National Highlights
- Nationally, the number of establishments increased 1.3 percent to 7.7 million in 2015. Employment rose 2.5 percent to 124.1 million employees in 2015, from 121.1 million in 2014.
- Annual payroll was up 5.3 percent, from $5.9 trillion in 2014 to $6.3 trillion in 2015.
- Average payroll per employee climbed 2.7 percent, from $49,062 in 2014 to $50,396 in 2015.
State and County Highlights
- California had more establishments (908,120) and employees (14.3 million) and a larger annual payroll ($857 billion) than any other state in 2015. Texas followed in each measure (569,091 establishments, 10.2 million employees and $521.1 billion in annual payroll). New York ranked third in all three measures: 540,298 establishments, 8.0 million employees and $513.1 billion in annual payroll.
- Utah had the highest employment growth rate at 4.9 percent. The Transportation and Warehousing sector (NAICS 48-49) led growth in that state, up 20.3 percent to 58,453 employees.
- Los Angeles County, Calif., led all counties in the number of establishments (265,112) and employees (4.0 million); followed by Cook County, Ill., in both measures (132,237 establishments and 2.4 million employees).
- New York County, N.Y. (Manhattan), topped all counties in annual payroll with $239.3 billion, while ranking third in establishments (105,444) and employees (2.2 million).
- Wayne County, Mich., rounded out the top 10 large counties, with an employment increase of 3.6 percent (up 21,650 employees), led by the Manufacturing sector (NAICS 31-33) where employment increased 8.4 percent. The leading subsector was Transportation Equipment Manufacturing (NAICS 336), in which employment increased 10.8 percent.
Information on businesses without paid employees will be released as part of the upcoming 2015 Nonemployer Statistics report in May 2017.
County Business Patterns data are also available for Puerto Rico, Guam, American Samoa, the Commonwealth of Northern Mariana Islands and the U.S. Virgin Islands.
County Business Patterns debuted 71 years ago and has been published annually for the past 51 years.
Tools for Accessing County Business Patterns
County Business Patterns data can be accessed using multiple tools available via the Census Bureau website, including American FactFinder, QuickFacts, Census Business Builder and My Congressional District.Other Sources of Local Area Economic Data
The Census Bureau conducts an economic census every five years and provides a comprehensive and detailed profile of the U.S. economy, covering millions of businesses representing more than 1,000 industries and providing unique portraits of American industries and local communities.County Business Patterns defines employment as all full- and part-time employees who were on the payroll during the pay period that includes March 12. Data are obtained from Census Bureau reports and administrative records from other federal agencies. Quality assurance procedures are applied to all phases of collection, processing and tabulation to minimize errors. The data are subject to nonsampling error from miscoding and estimation for missing or misreported data. Values associated with each establishment are slightly modified to protect the confidentiality of each location’s data. Data from NAICS sector 99, Industries Not Classified, are not included in this summary. Further information about methodology and data limitations is available at <www.census.gov/programs-surveys/cbp/technical-documentation/methodology.html>.
Source: U.S. Census Bureau

