
October 2, 2017 - LOS ANGELES – Even with a strong performance in August closed escrow sales, California pending home sales stalled for the second consecutive month, which suggests a softening in the housing market in the upcoming months, the CALIFORNIA ASSOCIATION OF REALTORS® (C.A.R.) said last week.
As August marks the end of the peak home-buying season, the housing market is showing signs of slowing as REALTORS® reported fewer floor calls, listing appointments, and client presentations. Open house traffic, however, remained strong in August, C.A.R.’s August Market Pulse Survey** found.
Pending home sales data:
• Based on signed contracts, year-over-year statewide pending home sales fell in August on a seasonally adjusted basis, with the Pending Home Sales Index (PHSI)* declining 3.5 percent from 121.3 in August 2016 to 117.0 in August 2017. California pending home sales also declined down on a monthly basis, decreasing 2.0 percent from the July index of 119.4.
• Pending home sales have declined on an annual basis for seven of the last eight months so far this year. After a solid run-up of pending sales growth in April, May, and July, continued housing inventory issues and affordability constraints may have pushed the market to a tipping point, suggesting the pace of growth will begin to slow in the fall.
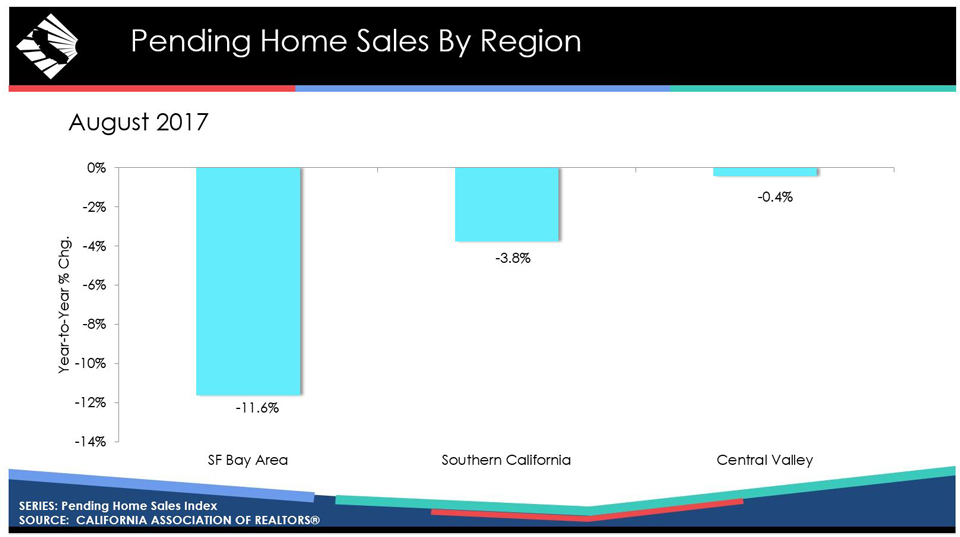
• All of the major regions recorded a decrease in pending sales from the previous year, with the San Francisco Bay Area experiencing the largest drop in pending sales, falling 11.6 percent on an annual basis. San Francisco, San Mateo, Santa Clara and Monterey counties were all down in double-digits of 11.8 percent, 14.0 percent, 13.4 percent, and 12.5 percent, respectively.
• Pending home sales were down 3.8 percent from the previous year in Southern California. Only Orange (1.8 percent) and San Bernardino (2.8 percent) counties posted a year-to-year increase. Los Angeles, Riverside, and San Diego counties registered lower annual pending sales of 1.7 percent, 10.3 percent, and 12.7 percent, respectively.
• Pending sales in the Central Valley dipped 0.4 percent from the previous year, led by a 13.9 percent annual decrease in Sacramento County, while Kern County recorded a 13.4 percent decrease from last August.
• C.A.R.’s Market Velocity Index – home sales relative to the number of new listings coming on line each month to replenish that sold inventory, or market indicator of future price appreciation – indicates that home prices should continue to stay strong as home sales continue to outstrip new listings, putting upward pressure on home prices through the fall.
• The Market Velocity Index increased from 59 to 69, indicating that there were 69 percent more homes sold than there were new listings. In other words, the supply of homes available for sale continued to drop, which will make the remaining units more competitive as net supply has deteriorated by roughly 45,000 units this year.
Year-to-Year Change in Pending Sales by County/Region
| County/Region/State | Aug-17 | Aug-16 | Yearly % Change |
| Kern | 71.8 | 82.9 | -13.4% |
| Los Angeles | 88.5 | 90.0 | -1.7% |
| Orange | 74.7 | 73.3 | 1.8% |
| Riverside | 52.8 | 58.8 | -10.3% |
| San Diego | 129.8 | 148.8 | -12.7% |
| San Bernardino | 78.3 | 76.2 | 2.8% |
| Monterey | 59.4 | 67.9 | -12.5% |
| Sacramento | 69.5 | 80.7 | -13.9% |
| San Francisco | 78.0 | 88.4 | -11.8% |
| San Mateo | 86.4 | 100.4 | -14.0% |
| Santa Clara | 87.4 | 101.0 | -13.4% |
| Santa Cruz | 115.1 | 130.9 | -12.1% |
| San Francisco Bay Area | 131.8 | 149.2 | -11.6% |
| Southern California | 99.5 | 103.4 | -3.8% |
| Central Valley | 104.8 | 105.2 | -0.4% |
| California (SA)* | 117.0 | 121.3 | -3.5% |
August REALTOR® Market Pulse Survey**:
• The share of homes selling above asking price increased from 29 percent a year ago to 31 percent in August, while the share of properties selling below asking price fell from 41 percent to 37 percent. The remaining 32 percent sold at asking price, up from 30 percent in August 2016.
• For homes that sold above asking price, the premium paid over asking price rose from 10 percent in August 2016 to 12 percent in August 2017.
• The 36 percent of homes that sold below asking price sold for an average of 12 percent below asking price in August, unchanged from a year ago.
• About two-thirds (60 percent) of properties sold in August received multiple offers, down from 62 percent in August 2016, and the number of offers received was slightly down at 2.7 offers.
• The share of properties receiving three or more offers in August was 38 percent, compared to 42 percent a year ago.
• Market competitiveness increased the most in homes priced $300,000-$399,999 and $1 million-$1,999,999 compared with last year, with 28 percent of properties receiving three or more offers up from 38 percent and up from 44 percent to 55 percent, respectively.
• Listing prices are more in line with the market as the proportion of homes that had listing price reductions decreased from 31 percent a year ago to 23 percent in August.
• Thirty-five percent of REALTORS® cited a lack of available homes for sale as their top concern, up significantly from 19 percent in August 2016. Declining housing affordability/high interest rates concerned 27 percent of REALTORS®, while inflated home prices/housing bubble was cited by 23 percent of REALTORS®. A slowdown in economic growth, lending and financing, and policy and regulations rounded out REALTORS®’ remaining biggest concerns.
• REALTORS®’ expectations of market conditions over the next year improved from 51 a year ago to 56 in August and is still in positive territory.
Graphics (click links to open):
• YTY change in pending home sales by region.
• Pending sales vs. closed escrow sales.
• Fewer properties selling below asking price.
• Multiple offers decline.
• Market competitiveness by price segment.
• Market Velocity – indicator of future price appreciation.
*Note: C.A.R.’s pending sales information is generated from a survey of more than 70 associations of REALTORS® and MLSs throughout the state. Pending home sales are forward-looking indicators of future home sales activity, offering solid information on future changes in the direction of the market. A sale is listed as pending after a seller has accepted a sales contract on a property. The majority of pending home sales usually become closed sales transactions one to two months later. The year 2008 was used as the benchmark for the Pending Homes Sales Index. An index of 100 is equal to the average level of contract activity during 2008.
**C.A.R.’s Market Pulse Survey is a monthly online survey sent to more than 10,000 California REALTORS® to measure data about their last closed transaction and sentiment about business activity in their market area for the previous month. More than 400 REALTORS® responded.
Leading the way...® in California real estate for more than 110 years, the CALIFORNIA ASSOCIATION OF REALTORS® (www.car.org) is one of the largest state trade organizations in the United States with more than 190,000 members dedicated to the advancement of professionalism in real estate. C.A.R. is headquartered in Los Angeles.
Source: C.A. R.