


- Existing, single-family home sales totaled 406,920 in July on a seasonally adjusted annualized rate, down 0.9 percent from June and down 3.4 percent from July 2017.
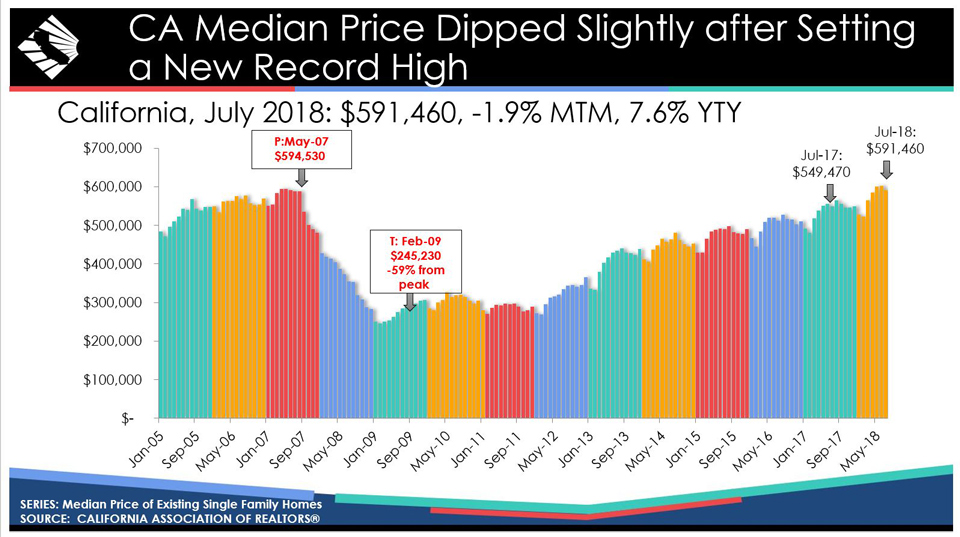
- July’s statewide median home price was $591,460, down 1.9 percent from June and up 7.6 percent from July 2017.
- California condominium/townhome median price hit another record high in July at $486,330.
August 20, 2018 - LOS ANGELES - California’s housing market backpedaled in July on an annual basis for the third consecutive month as higher interest rates and rising home prices eroded housing affordability and dampened demand, the CALIFORNIA ASSOCIATION OF REALTORS® (C.A.R.)® (C.A.R.) said last week.
Closed escrow sales of existing, single-family detached homes in California totaled a seasonally adjusted annualized rate of 406,920 units in July, according to information collected by C.A.R. from more than 90 local REALTOR® associations and MLSs statewide. The statewide annualized sales figure represents what would be the total number of homes sold during 2018 if sales maintained the July pace throughout the year. It is adjusted to account for seasonal factors that typically influence home sales.
July’s sales figure was down 0.9 percent from the revised 410,800 level in June and down 3.4 percent compared with home sales in July 2017 of 421,460.
“In the midst of the peak home-buying season, high home prices and rising interest rates combined to crimp housing affordability, which in turn is subduing home sales,” said C.A.R. President Steve White. “Some of the reluctance by buyers appears to be driven by fears that the market may be peaking. Additionally, the lack of a federal tax incentive for homeownership could be at play given that much of the weakness is in the lower-priced, first-time buyer segment of the market.”
The statewide median home price decreased to $591,460 in July. The July statewide median price was down 1.9 percent from $602,760 in June and up 7.6 percent from a revised $549,470 in July 2017.
“While home sales continued to decline in recent months, the softening of the market is more indicative of a market shift rather than a major market correction,” said C.A.R. Senior Vice President and Chief Economist Leslie Appleton-Young. “Despite the slowdown, there were some silver linings in the market in July. For example, homes priced between $500,000 and $1 million posted modest gains of about 5 percent in July thanks to growing inventory. Additionally, every price segment above $1 million continued to enjoy double-digit sales gains.”
Other key points from C.A.R.’s July 2018 resale housing report include:
- On a regionwide, non-seasonally adjusted basis, sales in the Bay Area fell 7.1 percent monthly and increased 2.0 percent annually. Sales in the Inland Empire declined 6.1 percent from June and were up a nominal 0.1 percent from a year ago. Sales in the Los Angeles metro region dropped 11.3 percent from June and were essentially flat from a year ago.
- The erosion of affordability continues to drive the dynamics of the housing market in the Bay Area Region with the East Bay continuing to pick up sales as workers get priced out of the larger employment centers in the Peninsula and Silicon Valley. Sales in Contra Costa and Alameda counties were up by more than 10 percent in July. Sales in Napa County, one of the region’s more affordable areas, recorded a 13.9 percent gain as did Solano County – the most affordable market in the Bay Area. San Mateo County was the outlier amongst the Bay Area’s core employment centers, posting a 10.9 percent increase while sales in San Francisco and Santa Clara counties dropped 6.9 percent and 16.7 percent, respectively.
- Home sales in the Central Valley Region were down 1.3 percent from a year ago with only Kern, Merced, San Joaquin, and Tulare counties recording annual sales gains, while Fresno, Glenn, Kings, Madera, Placer, Sacramento, San Benito, and Stanislaus counties posted a sales decline from July 2017.
- The Southern California Region housing market was essentially flat compared to last year with sales ticking up 0.1 percent. Ventura County led the region with a 9.4 percent sales increase, followed by a modest uptick of 1.3 percent in Riverside. The core employment centers of the region continued to struggle as Orange and Los Angeles counties saw sales declines of 0.9 percent and 1.4 percent, respectively. Sales in San Diego inched up 0.7 percent in July.
- The Bay Area continues to see prices climb ever-higher with many markets experiencing double-digit growth in closed-sale prices. San Francisco, Santa Clara, and Alameda – all counties where more than half of the homes sold were over $1 million – each saw prices rise by more than 10 percent from last year. Prices in Sonoma were essentially flat, but the remainder of the region continued to experience healthy gains in the mid- to single-digits.
- Home prices in Southern California continued to rise as well, despite posting lackluster sales. Price increases in every county were in the single-digits, though San Bernardino County saw prices rise by 9.7 percent. With the exception of Madera County, which suffered from recent major wildfires, every part of the Central Valley saw prices rise as well.
- Statewide active listings improved for the fourth consecutive month after 33 straight months of declines, increasing 11.9 percent from the previous year. July’s listings increase was the biggest in more than three years, and the number of active listings was the greatest supply of homes on the market in nearly two years.
- Much of the listings increase is attributable to lower-priced properties. With the exception of homes priced under $300,000, every price segment posted a double-digit increase in active listings in July.
- The unsold inventory index, which is a ratio of inventory over sales, edged up to 3.3 months in July from 3.2 months in July 2017. The index measures the number of months it would take to sell the supply of homes on the market at the current sales rate.
- The median number of days it took to sell a California single-family home remained low at 18 days in July, ticking up from 16 days in July 2017.
- C.A.R.’s statewide sales price-to-list price ratio* declined from a year ago for the first time in three years, dipping from 100.0 in July 2017 to 99.6 percent in July 2018.
- The average statewide price per square foot** for an existing, single-family home statewide was $289 in July, up from $270 in July 2017.
- The 30-year, fixed-mortgage interest rates averaged 4.53 percent in July, down from 4.57 percent in June and up from 3.97 percent in July 2017, according to Freddie Mac. The five-year, adjustable mortgage interest rate, however, edged higher in July to an average of 3.84 percent from 3.82 percent in June and from 3.22 percent in July 2017.
Graphics (click links to open):
- Calif. historical existing home sales.
- Calif. historical median home price.
- Condo/townhome median price sets new high.
- Price per square foot nears record high.
Note: The County MLS median price and sales data in the tables are generated from a survey of more than 90 associations of REALTORS® throughout the state and represent statistics of existing single-family detached homes only. County sales data are not adjusted to account for seasonal factors that can influence home sales. Movements in sales prices should not be interpreted as changes in the cost of a standard home. The median price is where half sold for more and half sold for less; medians are more typical than average prices, which are skewed by a relatively small share of transactions at either the lower-end or the upper-end. Median prices can be influenced by changes in cost, as well as changes in the characteristics and the size of homes sold. The change in median prices should not be construed as actual price changes in specific homes.
*Sales-to-list price ratio is an indicator that reflects the negotiation power of home buyers and home sellers under current market conditions. The ratio is calculated by dividing the final sales price of a property by its last list price and is expressed as a percentage. A sales-to-list ratio with 100 percent or above suggests that the property sold for more than the list price, and a ratio below 100 percent indicates that the price sold below the asking price.
**Price per square foot is a measure commonly used by real estate agents and brokers to determine how much a square foot of space a buyer will pay for a property. It is calculated as the sale price of the home divided by the number of finished square feet. C.A.R. currently tracks price-per-square foot statistics for 50 counties.
Leading the way…® in California real estate for more than 110 years, the CALIFORNIA ASSOCIATION OF REALTORS® (www.car.org) is one of the largest state trade organizations in the United States with more than 190,000 members dedicated to the advancement of professionalism in real estate. C.A.R. is headquartered in Los Angeles.
July 2018 County Sales and Price Activity
(Regional and condo sales data not seasonally adjusted)
|
July 2018 |
Median Sales Price of Existing Single-Family Homes |
Home Sales |
|||||||
|
State/Region/County |
July 2018 |
June 2018 |
July 2017 |
Price MTM% Chg |
Price YTY% Chg |
Sales MTM% Chg |
Sales YTY% Chg |
||
|
Calif. Single-family home |
$591,460 |
$602,760 |
$549,470 |
r |
-1.9% |
7.6% |
-0.9% |
-3.4% |
|
|
Calif. Condo/Townhomes |
$486,330 |
$482,930 |
$443,160 |
0.7% |
9.7% |
-5.6% |
-0.2% |
||
|
Los Angeles Metro Area |
$535,000 |
$539,000 |
$508,500 |
-0.7% |
5.2% |
-11.3% |
-0.1% |
||
|
Inland Empire |
$365,000 |
$360,000 |
$340,000 |
1.4% |
7.4% |
-6.1% |
0.1% |
||
|
San Francisco Bay Area |
$980,000 |
$1,045,000 |
$890,430 |
-6.2% |
10.1% |
-7.1% |
2.0% |
||
|
San Francisco Bay Area |
|||||||||
|
Alameda |
$970,000 |
$1,015,000 |
$875,500 |
-4.4% |
10.8% |
-6.0% |
15.5% |
||
|
Contra Costa |
$680,000 |
$702,373 |
$633,250 |
-3.2% |
7.4% |
-1.6% |
10.6% |
||
|
Marin |
$1,325,000 |
$1,415,000 |
$1,224,000 |
-6.4% |
8.3% |
-17.0% |
-11.6% |
||
|
Napa |
$727,000 |
$740,000 |
$695,000 |
-1.8% |
4.6% |
10.6% |
13.9% |
||
|
San Francisco |
$1,650,000 |
$1,620,000 |
$1,428,000 |
1.9% |
15.5% |
-17.2% |
-6.9% |
||
|
San Mateo |
$1,610,000 |
$1,650,500 |
$1,500,000 |
-2.5% |
7.3% |
-7.0% |
10.9% |
||
|
Santa Clara |
$1,351,000 |
$1,400,000 |
$1,165,000 |
-3.5% |
16.0% |
-14.6% |
-16.7% |
||
|
Solano |
$454,000 |
$450,000 |
$420,000 |
0.9% |
8.1% |
-2.2% |
4.4% |
||
|
Sonoma |
$650,000 |
$705,000 |
$645,000 |
-7.8% |
0.8% |
-4.0% |
-1.8% |
||
|
Southern California |
|||||||||
|
Los Angeles |
$597,520 |
$586,090 |
$566,240 |
2.0% |
5.5% |
-20.3% |
-0.9% |
||
|
Orange |
$829,000 |
$835,500 |
$785,000 |
-0.8% |
5.6% |
-5.8% |
-1.4% |
||
|
Riverside |
$408,000 |
$405,000 |
$385,500 |
0.7% |
5.8% |
-5.2% |
1.3% |
||
|
San Bernardino |
$292,000 |
$293,250 |
$266,250 |
-0.4% |
9.7% |
-7.4% |
-2.0% |
||
|
San Diego |
$650,000 |
$650,000 |
$613,000 |
0.0% |
6.0% |
-7.8% |
0.7% |
||
|
Ventura |
$662,360 |
$675,000 |
$648,500 |
-1.9% |
2.1% |
4.7% |
9.4% |
||
|
Central Coast |
|||||||||
|
Monterey |
$655,500 |
$632,500 |
$629,000 |
3.6% |
4.2% |
-13.3% |
2.9% |
||
|
San Luis Obispo |
$650,000 |
$612,500 |
$590,000 |
6.1% |
10.2% |
-20.4% |
1.1% |
||
|
Santa Barbara |
$550,000 |
$753,750 |
$611,000 |
-27.0% |
-10.0% |
-10.8% |
4.4% |
||
|
Santa Cruz |
$898,000 |
$925,000 |
$815,000 |
-2.9% |
10.2% |
5.7% |
30.5% |
||
|
Central Valley |
|||||||||
|
Fresno |
$280,000 |
$275,500 |
$259,900 |
1.6% |
7.7% |
-12.0% |
-3.1% |
||
|
Glenn |
$235,000 |
$227,710 |
$205,000 |
3.2% |
14.6% |
41.7% |
-19.0% |
||
|
Kern |
$250,000 |
$245,000 |
$235,000 |
2.0% |
6.4% |
-4.3% |
8.0% |
||
|
Kings |
$224,975 |
$245,000 |
$222,000 |
-8.2% |
1.3% |
6.3% |
-2.9% |
||
|
Madera |
$250,000 |
$268,000 |
$269,000 |
r |
-6.7% |
-7.1% |
-17.1% |
-38.3% |
|
|
Merced |
$267,450 |
$275,000 |
$260,000 |
-2.7% |
2.9% |
-3.8% |
16.8% |
||
|
Placer |
$495,000 |
$510,000 |
$453,000 |
-2.9% |
9.3% |
-18.3% |
-3.7% |
||
|
Sacramento |
$370,000 |
$375,000 |
$353,000 |
-1.3% |
4.8% |
-7.5% |
-1.6% |
||
|
San Benito |
$626,500 |
$570,400 |
$535,000 |
9.8% |
17.1% |
-8.0% |
-11.5% |
||
|
San Joaquin |
$370,000 |
$377,150 |
$350,000 |
-1.9% |
5.7% |
-3.9% |
4.3% |
||
|
Stanislaus |
$325,000 |
$320,000 |
$297,000 |
1.6% |
9.4% |
-8.2% |
-5.1% |
||
|
Tulare |
$239,000 |
$234,500 |
$219,950 |
1.9% |
8.7% |
-4.0% |
13.1% |
||
|
Other Calif. Counties |
|||||||||
|
Amador |
NA |
NA |
$320,000 |
NA |
NA |
NA |
NA |
||
|
Butte |
$315,000 |
$323,000 |
$299,900 |
-2.5% |
5.0% |
-7.3% |
-9.2% |
||
|
Calaveras |
$330,000 |
$313,000 |
$324,500 |
r |
5.4% |
1.7% |
2.9% |
16.7% |
|
|
Del Norte |
$210,000 |
$312,500 |
$204,900 |
-32.8% |
2.5% |
4.5% |
21.1% |
||
|
El Dorado |
$504,000 |
$525,000 |
$480,500 |
-4.0% |
4.9% |
8.9% |
20.7% |
||
|
Humboldt |
$310,000 |
$331,250 |
$307,500 |
-6.4% |
0.8% |
-10.4% |
2.6% |
||
|
Lake |
$249,950 |
$298,800 |
$265,000 |
-16.3% |
-5.7% |
-7.3% |
2.7% |
||
|
Lassen |
$185,000 |
$212,000 |
$171,000 |
-12.7% |
8.2% |
50.0% |
32.0% |
||
|
Mariposa |
$325,500 |
$311,000 |
$262,500 |
4.7% |
24.0% |
-38.9% |
10.0% |
||
|
Mendocino |
$393,750 |
$449,000 |
$370,000 |
-12.3% |
6.4% |
-10.1% |
8.8% |
||
|
Mono |
$899,500 |
$570,000 |
$578,000 |
57.8% |
55.6% |
-7.7% |
-36.8% |
||
|
Nevada |
$419,500 |
$452,000 |
$398,500 |
-7.2% |
5.3% |
-14.3% |
9.5% |
||
|
Plumas |
$290,000 |
$290,000 |
$325,000 |
0.0% |
-10.8% |
80.0% |
28.6% |
||
|
Shasta |
$280,000 |
$281,500 |
$255,000 |
-0.5% |
9.8% |
-15.5% |
0.8% |
||
|
Siskiyou |
$223,000 |
$187,500 |
$215,000 |
18.9% |
3.7% |
4.3% |
11.6% |
||
|
Sutter |
$294,500 |
$315,000 |
$280,300 |
-6.5% |
5.1% |
-24.7% |
0.0% |
||
|
Tehama |
$223,000 |
$234,900 |
$206,750 |
-5.1% |
7.9% |
-26.7% |
3.1% |
||
|
Tuolumne |
$315,000 |
$318,500 |
$292,500 |
-1.1% |
7.7% |
-3.3% |
30.9% |
||
|
Yolo |
$430,000 |
$450,000 |
$426,750 |
-4.4% |
0.8% |
-13.5% |
0.0% |
||
|
Yuba |
$289,000 |
$292,500 |
$266,889 |
-1.2% |
8.3% |
18.8% |
13.1% |
||
r = revised
NA = not available
July 2018 County Unsold Inventory and Time on Market
(Regional and condo sales data not seasonally adjusted)
|
July 2018 |
Unsold Inventory Index |
Median Time on Market |
||||||||
|
State/Region/County |
July 2018 |
June 2018 |
July 2017 |
July 2018 |
June 2018 |
July 2017 |
||||
|
Calif. Single-family |
3.3 |
3.0 |
3.2 |
18.0 |
15.0 |
16.0 |
r |
|||
|
Calif. Condo/Townhomes |
2.7 |
2.3 |
2.4 |
16.0 |
13.0 |
14.0 |
r |
|||
|
Los Angeles Metro Area |
3.7 |
3.3 |
|
3.6 |
23.0 |
20.0 |
20.0 |
r |
||
|
Inland Empire |
3.9 |
3.7 |
3.7 |
29.0 |
25.0 |
23.5 |
r |
|||
|
San Francisco Bay Area |
2.2 |
2.0 |
2.1 |
15.0 |
14.0 |
r |
14.0 |
r |
||
|
San Francisco Bay Area |
||||||||||
|
Alameda |
1.7 |
1.5 |
1.8 |
13.0 |
12.0 |
13.0 |
r |
|||
|
Contra Costa |
2.0 |
2.0 |
2.2 |
14.0 |
12.0 |
12.0 |
r |
|||
|
Marin |
2.9 |
2.5 |
2.3 |
24.0 |
28.0 |
31.0 |
r |
|||
|
Napa |
4.4 |
4.8 |
4.7 |
44.0 |
34.0 |
45.0 |
r |
|||
|
San Francisco |
1.6 |
1.4 |
1.4 |
15.0 |
13.0 |
15.0 |
r |
|||
|
San Mateo |
1.6 |
1.7 |
1.7 |
12.0 |
11.5 |
11.0 |
r |
|||
|
Santa Clara |
2.2 |
1.7 |
1.5 |
11.0 |
9.0 |
10.0 |
r |
|||
|
Solano |
2.8 |
2.6 |
2.7 |
32.0 |
32.0 |
31.5 |
r |
|||
|
Sonoma |
3.9 |
3.4 |
3.3 |
36.0 |
34.0 |
38.0 |
r |
|||
|
Southern California |
||||||||||
|
Los Angeles |
3.5 |
3.0 |
3.3 |
18.0 |
17.0 |
17.0 |
r |
|||
|
Orange |
3.5 |
3.2 |
3.4 |
19.0 |
15.0 |
17.0 |
r |
|||
|
Riverside |
3.6 |
3.5 |
3.5 |
28.0 |
26.0 |
24.0 |
r |
|||
|
San Bernardino |
4.3 |
3.9 |
4.0 |
r |
29.0 |
25.0 |
23.0 |
r |
||
|
San Diego |
3.2 |
2.8 |
2.9 |
14.0 |
13.0 |
13.0 |
r |
|||
|
Ventura |
4.9 |
4.7 |
5.0 |
43.0 |
40.0 |
43.5 |
r |
|||
|
Central Coast |
||||||||||
|
Monterey |
4.4 |
3.5 |
5.0 |
24.0 |
15.0 |
21.0 |
r |
|||
|
San Luis Obispo |
4.5 |
3.5 |
4.6 |
23.5 |
22.0 |
16.0 |
r |
|||
|
Santa Barbara |
4.6 |
4.0 |
4.7 |
25.0 |
20.0 |
25.0 |
r |
|||
|
Santa Cruz |
3.1 |
3.0 |
4.2 |
13.0 |
13.0 |
14.0 |
r |
|||
|
Central Valley |
||||||||||
|
Fresno |
3.1 |
2.7 |
3.0 |
r |
13.0 |
13.0 |
11.0 |
r |
||
|
Glenn |
4.3 |
6.3 |
3.5 |
20.0 |
18.5 |
17.0 |
r |
|||
|
Kern |
3.1 |
3.0 |
3.4 |
20.0 |
18.0 |
18.0 |
r |
|||
|
Kings |
3.0 |
3.1 |
2.9 |
22.5 |
19.5 |
28.0 |
r |
|||
|
Madera |
5.1 |
4.0 |
3.8 |
r |
27.0 |
27.0 |
27.0 |
r |
||
|
Merced |
2.9 |
2.8 |
3.2 |
25.0 |
15.0 |
13.0 |
r |
|||
|
Placer |
2.9 |
2.4 |
2.9 |
14.5 |
14.0 |
11.0 |
r |
|||
|
Sacramento |
2.6 |
2.3 |
2.3 |
12.0 |
10.0 |
9.0 |
r |
|||
|
San Benito |
3.3 |
2.7 |
3.5 |
12.5 |
11.5 |
23.5 |
r |
|||
|
San Joaquin |
2.8 |
2.6 |
2.9 |
15.0 |
13.0 |
13.0 |
r |
|||
|
Stanislaus |
3.2 |
2.7 |
2.8 |
16.0 |
12.0 |
12.0 |
r |
|||
|
Tulare |
3.4 |
3.2 |
3.8 |
23.0 |
23.0 |
24.0 |
r |
|||
|
Other Calif. Counties |
||||||||||
|
Amador |
NA |
NA |
5.2 |
NA |
NA |
32.0 |
r |
|||
|
Butte |
3.4 |
2.9 |
2.7 |
18.0 |
16.0 |
11.0 |
r |
|||
|
Calaveras |
5.9 |
6.0 |
6.8 |
40.0 |
29.0 |
38.5 |
r |
|||
|
Del Norte |
6.1 |
6.4 |
9.5 |
82.0 |
108.0 |
94.0 |
r |
|||
|
El Dorado |
3.7 |
4.2 |
4.7 |
28.0 |
21.0 |
27.0 |
r |
|||
|
Humboldt |
5.7 |
5.1 |
4.8 |
19.0 |
19.0 |
14.0 |
r |
|||
|
Lake |
6.3 |
6.2 |
6.5 |
38.0 |
40.0 |
34.5 |
r |
|||
|
Lassen |
5.8 |
8.9 |
7.5 |
93.0 |
69.0 |
70.0 |
r |
|||
|
Mariposa |
6.5 |
4.7 |
7.6 |
52.0 |
18.5 |
32.5 |
r |
|||
|
Mendocino |
7.8 |
7.1 |
6.2 |
59.5 |
74.0 |
71.0 |
r |
|||
|
Mono |
9.1 |
7.6 |
6.0 |
78.5 |
82.0 |
93.0 |
r |
|||
|
Nevada |
4.6 |
3.9 |
4.3 |
23.0 |
17.0 |
18.0 |
r |
|||
|
Plumas |
8.7 |
11.7 |
11.5 |
66.0 |
50.0 |
99.0 |
r |
|||
|
Shasta |
4.5 |
4.0 |
4.6 |
18.0 |
24.0 |
21.0 |
r |
|||
|
Siskiyou |
6.8 |
7.1 |
7.2 |
32.0 |
24.5 |
40.0 |
r |
|||
|
Sutter |
3.5 |
2.5 |
3.6 |
15.0 |
19.0 |
14.0 |
r |
|||
|
Tehama |
7.5 |
4.8 |
7.4 |
38.0 |
61.0 |
48.5 |
r |
|||
|
Tuolumne |
5.1 |
4.8 |
7.0 |
22.0 |
17.0 |
30.5 |
r |
|||
|
Yolo |
2.7 |
2.3 |
2.9 |
11.0 |
11.0 |
10.0 |
r |
|||
|
Yuba |
2.6 |
3.3 |
2.8 |
13.0 |
14.5 |
12.5 |
r |
|||
r = revised
NA = not available
Source: C.A.R.