


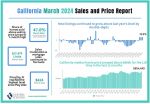


Statewide home sales remain subdued in November as year ends
Low housing affordability and short home supply remain hurdles for home buyers
LOS ANGELES (Dec. 17,2014) – Slower price gains and the lowest interest rates in nearly two years did little to spur November home sales as low housing affordability and tight supply conditions remained obstacles to entering the market for would-be buyers, the CALIFORNIA ASSOCIATION OF REALTORS® (C.A.R.) said today.
Closed escrow sales of existing, single-family detached homes in California totaled a seasonally adjusted annualized rate of 376,480 units in November, according to information collected by C.A.R. from more than 90 local REALTOR® associations and MLSs statewide. Sales in November were down 5.3 percent from a revised 397,400 in October and down 3.4 percent from a revised 389,580 in November 2013. Home sales have been below the 400,000 level since November 2013. The statewide sales figure represents what would be the total number of homes sold during 2014 if sales maintained the November pace throughout the year. It is adjusted to account for seasonal factors that typically influence home sales.
“The declining sales-to-list price ratio suggests that mismatched expectations of home prices between sellers and buyers still exist in most markets, except for the Bay Area, where there’s a dearth of homes for sale,” said 2015 C.A.R. President Chris Kutzkey. “Prospective buyers facing affordability constraints recognize the slowing housing market and are looking for deals, while many sellers are still reluctant to adjust their listing prices to reflect the moderation of price gains in recent months.”
The median price of an existing, single-family detached California home slipped 1.1 percent from October’s median price of $450,270 to $445,280 in November but was up 5.2 percent from the revised $423,090 recorded in November 2013. The statewide median home price has been higher on a year-over-year basis for more than two years, but price gains have narrowed over the past few months. The median sales price is the point at which half of homes sold for more and half sold for less; it is influenced by the types of homes selling as well as a general change in values.
“Despite a highly favorable interest rate environment, the housing market is being hindered by low housing affordability and a lack of homes for sale, especially in highly desired geographic areas,” said C.A.R. Vice President and Chief Economist Leslie Appleton-Young. “The San Francisco Bay Area, which has an extreme housing supply shortage due to robust economic growth, is a perfect example of how these factors have slowed down home sales this year.”
Other key facts from C.A.R.’s November 2014 resale housing report include:
• Housing inventory loosened in November, with the available supply of existing, single-family detached homes for sale rising from 3.8 months in October to 4.4 months in November. The index was 3.6 months in November 2013. The index indicates the number of months needed to sell the supply of homes on the market at the current sales rate. A six- to seven-month supply is considered typical in a normal market.
• The median number of days it took to sell a single-family home edged up in November, up from a revised 42.2 days in October to 43.9 days in November and from a revised 36.9 days in November 2013.
• According to C.A.R.’s newest housing market indicator measuring sales-to-list price ratio*, multiple bid offers for properties has waned, and properties are again generally selling below the list price. The statewide measure suggests that homes are selling at 97.2 percent of the list price. This is down from a 98.4% ratio at the same time last year. The Bay Area is the only region where homes are selling above list prices and are generally selling about 0.5 percent more than asking price.
• The median price per square foot** for an existing single-family California home was $214 in November 2014, a decrease of 0.9 percent from the previous month and a 4.4 percent increase from November 2013. Price per square foot at the state level has been showing an upward trend since early 2012. In fact, it has been rising on a year-over-year basis for 34 consecutive months. San Mateo County had the highest price per square foot in November with $654/sq. ft., followed by Santa Clara ($502/sq. ft.), and Santa Cruz ($399/sq. ft.). The top three counties with the lowest price per square foot in November were Glenn ($64/sq. ft.), Siskiyou ($104/sq. ft.), and Madera ($108/sq. ft.).
• Mortgage rates fell in November, with the 30-year, fixed-mortgage interest rate averaging 4 percent, down from 4.04 percent in October and down from 4.26 percent in November 2013, according to Freddie Mac. The November 2014 average 30-year fixed rate was the lowest since May 2013, just before the Federal Reserve announced its intention to taper the bond buying program. Adjustable-mortgage interest rates, however, rose in November, averaging 2.44 percent, up from 2.41 percent in October but down from 2.61 percent in November 2013.
Graphics (click links to open):
• November sales at-a-glance infographic.
• Unsold Inventory by price range.
• Change in sales by price range.
• Share of sales by price range.
Note: The County MLS median price and sales data in the tables are generated from a survey of more than 90 associations of REALTORS® throughout the state, and represent statistics of existing single-family detached homes only. County sales data are not adjusted to account for seasonal factors that can influence home sales. Movements in sales prices should not be interpreted as changes in the cost of a standard home. The median price is where half sold for more and half sold for less; medians are more typical than average prices, which are skewed by a relatively small share of transactions at either the lower-end or the upper-end. Median prices can be influenced by changes in cost, as well as changes in the characteristics and the size of homes sold. Due to the low sales volume in some areas, median price changes in November exhibit unusual fluctuation. The change in median prices should not be construed as actual price changes in specific homes.
*Sales-to-list price ratio is an indicator that reflects the negotiation power of home buyers and home sellers under current market conditions. The ratio is calculated by dividing the final sales price of a property by its last list price and is expressed as a percentage. A sales-to-list ratio with 100 percent or above suggests that the property sold for more than the list price, and a ratio below 100 percent indicates that the price sold below the asking price.
**Price per square foot is a measure commonly used by real estate agents and brokers to determine how much a square foot of space a buyer will pay for a property. It is calculated as the sale price of the home divided by the number of finished square feet. C.A.R. currently tracks price-per-square foot statistics for 33 counties.
Leading the way…® in California real estate for more than 100 years, the CALIFORNIA ASSOCIATION OF REALTORS® (www.car.org) is one of the largest state trade organizations in the United States with 165,000 members dedicated to the advancement of professionalism in real estate. C.A.R. is headquartered in Los Angeles.
November 2014 County Sales and Price Activity
(Regional and condo sales data not seasonally adjusted)
| November-14 | Median Sold Price of Existing Single-Family Homes | Sales | |||||||
| State/Region/County | Nov-14 | Oct-14 | Nov-13 | MTM% Chg | YTY% Chg | MTM% Chg | YTY% Chg | ||
| CA SFH (SAAR) | $445,280 | $450,270 | r | $423,090 | r | -1.1% | 5.2% | -5.3% | -3.4% |
| CA Condo/Townhomes | $369,040 | $374,480 | $347,050 | r | -1.5% | 6.3% | -21.8% | -10.7% | |
| Los Angeles Metro Area | $417,270 | $412,190 | r | $396,790 | r | 1.2% | 5.2% | -21.2% | -6.8% |
| Inland Empire | $276,950 | $274,630 | r | $261,490 | r | 0.8% | 5.9% | -19.6% | -4.5% |
| S.F. Bay Area | $748,870 | $760,610 | $692,860 | r | -1.5% | 8.1% | -21.5% | -6.3% | |
| S.F. Bay Area | |||||||||
| Alameda | $710,370 | $706,280 | $652,070 | 0.6% | 8.9% | -23.7% | -17.1% | ||
| Contra-Costa (Central Cty) | $654,410 | $721,590 | $698,110 | r | -9.3% | -6.3% | -17.7% | 3.0% | |
| Marin | $1,111,110 | $969,700 | $942,070 | 14.6% | 17.9% | -27.0% | -10.5% | ||
| Napa | $625,000 | $599,140 | $528,410 | 4.3% | 18.3% | -20.4% | -11.8% | ||
| San Francisco | $956,320 | $986,260 | $896,740 | -3.0% | 6.6% | -22.4% | -4.0% | ||
| San Mateo | $1,092,500 | $1,071,000 | $895,000 | 2.0% | 22.1% | -23.8% | -3.4% | ||
| Santa Clara | $850,000 | $870,000 | $785,000 | r | -2.3% | 8.3% | -24.1% | -9.4% | |
| Solano | $332,020 | $327,460 | $280,360 | 1.4% | 18.4% | -22.0% | 0.4% | ||
| Sonoma | $487,110 | $487,930 | $463,820 | -0.2% | 5.0% | -10.2% | 1.8% | ||
| Southern California | |||||||||
| Los Angeles | $433,850 | $477,600 | $405,470 | r | -9.2% | 7.1% | -25.4% | -9.4% | |
| Orange County | $689,480 | $692,390 | $660,890 | -0.4% | 4.3% | -13.8% | -5.7% | ||
| Riverside County | $320,880 | $321,750 | r | $306,350 | -0.3% | 4.7% | -18.4% | -6.9% | |
| San Bernardino | $213,780 | $208,080 | $192,470 | r | 2.7% | 11.1% | -21.4% | -0.8% | |
| San Diego | $491,690 | $493,030 | $473,360 | -0.3% | 3.9% | -22.5% | -13.2% | ||
| Ventura | $549,440 | $583,810 | $543,330 | -5.9% | 1.1% | -18.5% | -4.7% | ||
| Central Coast | |||||||||
| Monterey | $460,000 | $460,000 | $420,000 | 0.0% | 9.5% | -28.0% | -2.2% | ||
| San Luis Obispo | $453,950 | $455,660 | $486,510 | -0.4% | -6.7% | -23.4% | -20.4% | ||
| Santa Barbara | $643,290 | $570,000 | $558,330 | 12.9% | 15.2% | -19.5% | -12.1% | ||
| Santa Cruz | $689,500 | $715,000 | $666,000 | -3.6% | 3.5% | -25.1% | -8.8% | ||
| Central Valley | |||||||||
| Fresno | $200,000 | $200,600 | $193,020 | -0.3% | 3.6% | -20.9% | -3.7% | ||
| Glenn | $95,000 | $167,500 | $150,000 | -43.3% | -36.7% | -58.8% | -68.2% | ||
| Kern (Bakersfield) | $211,450 | $215,000 | $190,000 | -1.7% | 11.3% | -21.3% | -15.2% | ||
| Kings County | $192,500 | $168,670 | $171,670 | 14.1% | 12.1% | -21.9% | -10.9% | ||
| Madera | $235,710 | $166,000 | $160,000 | 42.0% | 47.3% | -4.3% | 10.0% | ||
| Merced | $177,650 | $190,710 | $151,540 | -6.8% | 17.2% | -23.5% | -16.2% | ||
| Placer County | $369,490 | $380,170 | $361,160 | -2.8% | 2.3% | -29.9% | -3.1% | ||
| Sacramento | $266,260 | $270,150 | $246,900 | -1.4% | 7.8% | -21.7% | -3.3% | ||
| San Benito | $431,000 | $435,000 | $380,000 | -0.9% | 13.4% | -33.3% | -18.9% | ||
| San Joaquin | $249,080 | $263,270 | $233,070 | -5.4% | 6.9% | -28.9% | -22.7% | ||
| Stanislaus | $230,950 | $228,630 | $198,400 | 1.0% | 16.4% | -27.3% | -13.2% | ||
| Tulare | $187,000 | $179,060 | $161,300 | 4.4% | 15.9% | -25.9% | -15.8% | ||
| Other Counties in California | |||||||||
| Amador | $231,250 | $265,000 | $212,500 | -12.7% | 8.8% | -29.3% | -17.1% | ||
| Butte County | $260,710 | $247,580 | $255,950 | 5.3% | 1.9% | -43.3% | -2.2% | ||
| Calaveras | $235,000 | $245,000 | $215,000 | -4.1% | 9.3% | -24.1% | 3.3% | ||
| Del Norte | $127,500 | $160,000 | $135,000 | -20.3% | -5.6% | -26.3% | -26.3% | ||
| El Dorado County | $374,540 | $355,800 | $361,860 | 5.3% | 3.5% | -31.1% | -12.6% | ||
| Humboldt | $262,500 | $260,340 | $239,280 | 0.8% | 9.7% | -19.1% | 23.6% | ||
| Lake County | $186,670 | $190,000 | $143,330 | -1.8% | 30.2% | -4.9% | -18.3% | ||
| Tuolumne | $220,000 | $219,640 | $212,500 | 0.2% | 3.5% | -23.3% | 7.7% | ||
| Mendocino | $332,140 | $337,500 | $300,000 | -1.6% | 10.7% | -22.9% | -7.5% | ||
| Nevada | $338,000 | $323,000 | $297,000 | 4.6% | 13.8% | -31.5% | -10.6% | ||
| Plumas | $192,500 | $242,000 | $259,000 | -20.5% | -25.7% | -31.9% | 18.5% | ||
| Shasta | $210,610 | $220,920 | $207,560 | -4.7% | 1.5% | -29.4% | -19.2% | ||
| Siskiyou County | $172,500 | $161,670 | $166,670 | 6.7% | 3.5% | 19.4% | 15.6% | ||
| Sutter | $218,180 | $213,240 | $207,140 | r | 2.3% | 5.3% | -24.6% | 13.0% | |
| Tehama | $175,000 | $160,000 | $180,000 | 9.4% | -2.8% | -37.0% | 45.0% | ||
| Yolo | $343,180 | $344,740 | $283,330 | -0.5% | 21.1% | 1.8% | 18.4% | ||
| Yuba | $190,000 | $210,940 | $207,350 | r | -9.9% | -8.4% | -19.5% | 17.0% | |
r = revised
NA = not available
November 2014 County Unsold Inventory and Time on Market
(Regional and condo sales data not seasonally adjusted)
| November-14 | Unsold Inventory Index | Median Time on Market | ||||||||
| State/Region/County | Nov-14 | Oct-14 | Nov-13 | Nov-14 | Oct-14 | Nov-13 | ||||
| CA SFH (SAAR) | 4.4 | 3.8 | 3.6 | 43.9 | 42.2 | r | 36.9 | r | ||
| CA Condo/Townhomes | 3.8 | 3.3 | 3.2 | r | 40.7 | 41.3 | 36.7 | r | ||
| Los Angeles Metro Area | 4.9 | 4.3 | r | 3.9 | 53.5 | 52.2 | r | 42.8 | ||
| Inland Empire | 5.8 | 4.7 | 4.6 | r | 56.0 | 55.3 | r | 40.0 | r | |
| S.F. Bay Area | 2.3 | 2.2 | 2.2 | r | 40.6 | 38.7 | 40.5 | r | ||
| S.F. Bay Area | ||||||||||
| Alameda | 1.9 | 2.0 | 1.7 | 51.5 | 49.5 | 51.2 | ||||
| Contra-Costa (Central County) | 2.0 | 2.4 | 1.6 | r | 54.8 | 54.2 | 54.3 | r | ||
| Marin | 2.7 | 2.5 | 2.7 | 40.3 | 38.9 | 44.6 | ||||
| Napa | 5.3 | 4.7 | 4.6 | 56.5 | 64.8 | 53.6 | ||||
| San Francisco | 2.3 | 2.0 | 2.4 | 25.1 | 22.5 | 25.5 | ||||
| San Mateo | 1.4 | 1.6 | 2.0 | 21.3 | 19.5 | 20.9 | ||||
| Santa Clara | 1.9 | 1.8 | 1.8 | 21.7 | 20.9 | 21.2 | ||||
| Solano | 3.5 | 2.4 | 3.1 | 46.0 | 45.0 | 41.7 | ||||
| Sonoma | 2.9 | 3.2 | 3.2 | 50.7 | 50.2 | 54.4 | ||||
| Southern California | ||||||||||
| Los Angeles | 4.4 | 3.9 | 3.5 | r | 47.8 | 45.5 | 38.5 | r | ||
| Orange County | 4.1 | 4.1 | 3.8 | 61.2 | 62.3 | 53.2 | ||||
| Riverside County | 6.1 | 4.9 | 4.8 | 57.2 | 58.7 | r | 40.3 | |||
| San Bernardino | 5.3 | 4.5 | 4.3 | r | 54.0 | 49.6 | 39.5 | r | ||
| San Diego | 4.9 | 4.3 | 4.1 | 28.1 | 28.3 | 29.3 | ||||
| Ventura | 4.8 | 4.4 | 3.5 | 66.6 | 63.0 | 52.4 | ||||
| Central Coast | ||||||||||
| Monterey | 4.8 | 3.8 | 4.3 | 34.9 | 26.2 | 27.8 | ||||
| San Luis Obispo | 5.1 | 4.3 | 4.0 | 49.9 | 50.2 | 47.4 | ||||
| Santa Barbara | 4.9 | 4.4 | 4.3 | 45.8 | 41.5 | 34.3 | ||||
| Santa Cruz | 3.5 | 3.1 | 3.5 | 26.5 | 33.7 | 29.0 | ||||
| Central Valley | ||||||||||
| Fresno | 5.7 | 4.9 | 5.1 | 31.2 | 29.4 | 26.3 | ||||
| Glenn | 12.0 | 5.5 | 3.6 | 45.5 | 47.9 | 31.0 | ||||
| Kern (Bakersfield) | 4.0 | 3.4 | r | 2.8 | r | 31.0 | 27.0 | r | 22.0 | r |
| Kings County | 4.4 | 3.6 | 3.9 | 29.5 | 44.5 | 41.4 | ||||
| Madera | 5.1 | 4.9 | 5.2 | 61.0 | 23.2 | 48.4 | ||||
| Merced | 4.8 | 3.9 | 2.7 | 46.8 | 46.3 | 24.1 | ||||
| Placer County | 4.2 | 3.5 | 3.6 | 28.4 | 29.6 | 26.4 | ||||
| Sacramento | 3.7 | 3.3 | 3.5 | 26.5 | 25.8 | 22.7 | ||||
| San Benito | 4.8 | 3.7 | 3.5 | 26.6 | 40.2 | 26.5 | ||||
| San Joaquin | 4.4 | 3.4 | 2.8 | 27.7 | 25.5 | 23.9 | ||||
| Stanislaus | 4.4 | 3.5 | 3.2 | 25.0 | 25.2 | 22.3 | ||||
| Tulare | 5.5 | 4.4 | 4.0 | 34.5 | 42.8 | 29.1 | ||||
| Other Counties in California | ||||||||||
| Amador | 7.2 | 5.9 | 5.3 | 47.9 | 65.8 | 40.2 | ||||
| Butte County | 4.8 | 3.1 | 5.0 | 36.3 | 35.8 | 35.8 | ||||
| Calaveras | 8.5 | 6.7 | 7.1 | 75.0 | 59.0 | 77.0 | ||||
| Del Norte | 12.1 | 9.5 | 7.6 | 83.0 | 106.0 | 79.0 | ||||
| El Dorado County | 5.2 | 4.3 | 4.5 | 54.8 | 55.1 | 50.0 | ||||
| Humboldt | 6.2 | 5.4 | 7.6 | 59.1 | 52.4 | 37.2 | ||||
| Lake County | 6.5 | 7.2 | 4.9 | 107.9 | 80.0 | 96.4 | ||||
| Tuolumne | 6.8 | 6.0 | 7.7 | 70.7 | 73.3 | 49.1 | ||||
| Mendocino | 9.4 | 7.4 | 8.0 | 101.9 | 91.0 | 108.4 | ||||
| Nevada | 6.8 | 5.4 | 5.2 | 59.0 | 50.0 | 42.0 | ||||
| Plumas | 9.4 | 8.1 | 11.1 | 206.0 | 174.0 | 118.0 | ||||
| Shasta | 7.1 | 5.5 | 4.9 | 51.3 | 56.1 | 37.8 | ||||
| Siskiyou County | 9.4 | 12.4 | 10.1 | 77.9 | 45.5 | 80.3 | ||||
| Sutter | 5.1 | 4.1 | 3.9 | r | 55.9 | 24.8 | 24.0 | r | ||
| Tehama | 7.1 | 4.7 | 9.8 | 43.1 | 41.2 | 49.1 | ||||
| Yolo | 2.8 | 3.4 | 3.4 | 36.1 | 23.3 | 22.5 | ||||
| Yuba | 3.7 | 2.9 | 3.7 | r | 31.0 | 40.0 | 23.6 | r | ||
NA = not available