


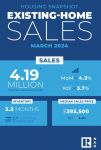


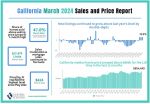


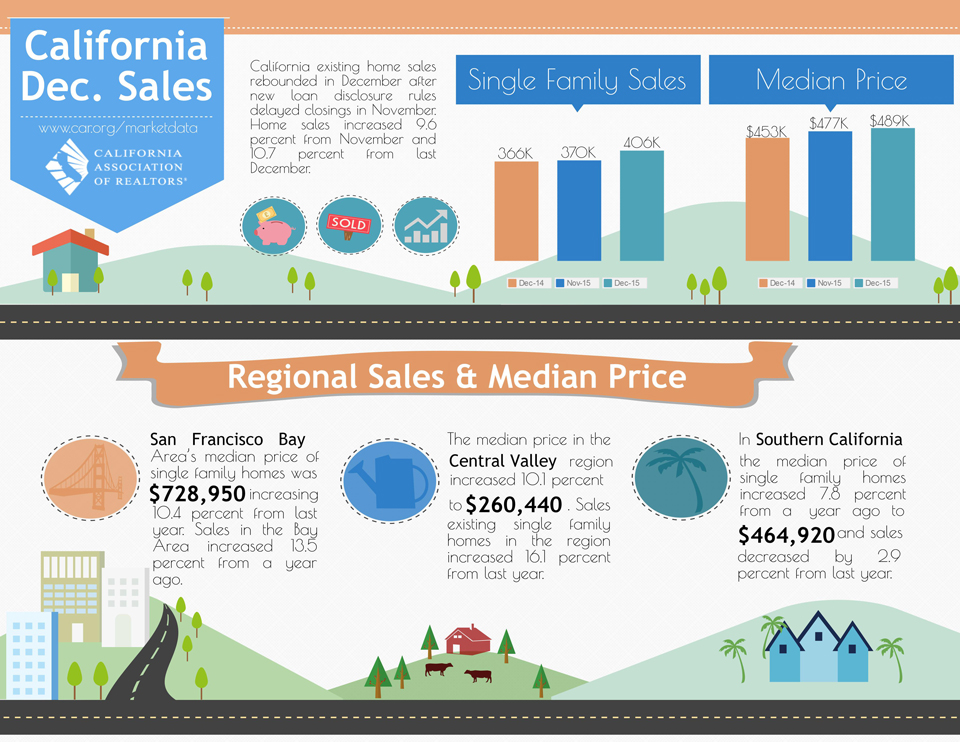
- Existing, single-family home sales totaled 405,530 in December on a seasonally adjusted annualized rate, up 9.6 percent from November and up 10.7 percent from December 2014.
- December’s statewide median home price was $489,310, up 2.6 percent from November and up 8.0 percent from December 2014.
- Sales of condos and townhomes were up 25.1 percent from November and were 10.2 percent higher than a year ago.
LOS ANGELES (Jan. 15, 2016) – California existing home sales rebounded in December after new loan disclosure rules delayed closings in November, the CALIFORNIA ASSOCIATION OF REALTORS® (C.A.R.) said today.
Home sales exceeded the 400,000-unit level in December after falling short in November. Closed escrow sales of existing, single-family detached homes in California totaled a seasonally adjusted annualized rate of 405,530 units in December, according to information collected by C.A.R. from more than 90 local REALTOR® associations and MLSs statewide. The statewide sales figure represents what would be the total number of homes sold during 2015 if sales maintained the December pace throughout the year. It is adjusted to account for seasonal factors that typically influence home sales.
For 2015 as a whole, a preliminary figure of 407,060 single-family homes closed escrow in California, up 6.4 percent from a revised 382,720 in 2014.
The December figure was up 9.6 percent from the revised 370,070 level in November and up 10.7 percent compared with home sales in December 2014 of a revised 366,460. The month-to-month increase in sales was the largest since January 2011, and the year-to-year increase was the largest since July 2015.
“As we speculated, sales that were delayed in November because of The Consumer Financial Protection Bureau’s new loan disclosure rules closed in December instead, which led to the greatest monthly sales increase in nearly five years,” said C.A.R. President Ziggy Zicarelli. “Sales increased across the board in all price segments in December, but improvement in the sub-$500,000 market was more pronounced as many homes affected by the new loan disclosures were priced under the conforming loan limit.”
The median price of an existing, single-family detached California home rose 2.6 percent in December to $489,310 from $477,060 in November. December’s median price was 8.0 percent higher than the revised $453,270 recorded in December 2014. The median sales price is the point at which half of homes sold for more and half sold for less; it is influenced by the types of homes selling as well as a general change in values. The year-to-year price gain was the largest since August 2014.
“In line with our forecast, California’s housing market experienced strong sales and price growth throughout last year, with the median price increasing 6.2 percent for the year as a whole to reach $474,420 in 2015,” said C.A.R. Vice President and Chief Economist Leslie Appleton-Young. “Looking forward, we expect the foundation for the housing market to remain strong throughout the year, with moderate increases in home sales and prices, but headwinds of tight housing supply and low affordability will remain a challenge.”
Other key points from C.A.R.’s December 2015 resale housing report include:
• While more sales closed in December, the number of active listings continued to drop from both the previous month and year. Active listings at the statewide level dropped 11.7 percent from November and decreased 7.9 percent from December 2014. At the regional level, total active listings continued to decline from the previous year in Southern California, Central Valley, and the San Francisco Bay Area, dropping 9.6 percent, 7.6 percent, and 5.2 percent, respectively.
• The sharp increase in sales in December and fewer listings combined to tighten the available supply of homes on the market. C.A.R.’s Unsold Inventory Index fell to 2.8 months in December from 4.2 months in November. The index stood at 3.2 months in December 2014. The index indicates the number of months needed to sell the supply of homes on the market at the current sales rate. A six- to seven-month supply is considered typical in a normal market.
• The median number of days it took to sell a single-family home increased in December to 39.5 days, compared with 37.5 days in November and 44.1 days in December 2014.
• According to C.A.R.’s newest housing market indicator, which measures the sales-to-list price ratio*, properties are generally selling below the list price, except in the San Francisco Bay Area, where a lack of homes for sale is pushing sales prices higher than original asking prices. The statewide measure suggests that homes sold at a median of 97.9 percent of the list price in December, up from 97.2 percent at the same time last year. The Bay Area is the only region where homes are selling above original list prices due to constrained supply with a ratio of 100.7 percent in December, up from 100 percent a year ago.
• The average price per square foot** for an existing, single-family home was $230 in December 2015, up from $222 in December 2014.
• San Francisco continued to have the highest price per square foot in December at $749/sq. ft., followed by San Mateo ($715/sq. ft.), and Santa Clara ($568/sq. ft.). The three counties with the lowest price per square foot in December were Siskiyou ($107/sq. ft.), Tulare ($123/sq. ft.), and Merced ($124/sq. ft.).
• Mortgage rates inched up in December, with the 30-year, fixed-mortgage interest rate averaging 3.96 percent, up from 3.94 percent in November and up from 3.86 percent in December 2014, according to Freddie Mac. Adjustable-mortgage interest rates also edged up, averaging 2.66 percent in December, up from 2.63 percent in November and up from 2.40 percent in December 2014.
Graphics (click links to open):
• December sales at-a-glance infographic.
• Calif. existing home sales historical.
• Share of sales by price range.
• Sales to active listings ratio.
• Sales to list price ratio.
• Price per square foot.
Note: The County MLS median price and sales data in the tables are generated from a survey of more than 90 associations of REALTORS® throughout the state, and represent statistics of existing single-family detached homes only. County sales data are not adjusted to account for seasonal factors that can influence home sales. Movements in sales prices should not be interpreted as changes in the cost of a standard home. The median price is where half sold for more and half sold for less; medians are more typical than average prices, which are skewed by a relatively small share of transactions at either the lower-end or the upper-end. Median prices can be influenced by changes in cost, as well as changes in the characteristics and the size of homes sold. The change in median prices should not be construed as actual price changes in specific homes.
*Sales-to-list price ratio is an indicator that reflects the negotiation power of home buyers and home sellers under current market conditions. The ratio is calculated by dividing the final sales price of a property by its last list price and is expressed as a percentage. A sales-to-list ratio with 100 percent or above suggests that the property sold for more than the list price, and a ratio below 100 percent indicates that the price sold below the asking price.
**Price per square foot is a measure commonly used by real estate agents and brokers to determine how much a square foot of space a buyer will pay for a property. It is calculated as the sale price of the home divided by the number of finished square feet. C.A.R. currently tracks price-per-square foot statistics for 38 counties.
Leading the way…® in California real estate for more than 110 years, the CALIFORNIA ASSOCIATION OF REALTORS® (www.car.org) is one of the largest state trade organizations in the United States with 185,000 members dedicated to the advancement of professionalism in real estate. C.A.R. is headquartered in Los Angeles.
December 2015 County Sales and Price Activity
(Regional and condo sales data not seasonally adjusted)
| December-15 | Median Sold Price of Existing Single-Family Homes | Sales | |||||||
| State/Region/County | Dec-15 | Nov-15 | Dec-14 | MTM% Chg | YTY% Chg | MTM% Chg | YTY% Chg | ||
| CA SFH (SAAR) | $489,310 | $477,060 | r | $453,270 | r | 2.6% | 8.0% | 9.6% | 10.7% |
| CA Condo/Townhomes | $394,110 | $396,740 | r | $364,310 | r | -0.7% | 8.2% | 25.1% | 10.2% |
| Los Angeles Metropolitan Area | $446,660 | $439,730 | $413,150 | 1.6% | 8.1% | 33.3% | 8.3% | ||
| Inland Empire | $300,130 | $293,220 | $281,660 | 2.4% | 6.6% | 29.0% | 6.7% | ||
| S.F. Bay Area | $728,950 | $744,750 | r | $660,200 | r | -2.1% | 10.4% | 18.0% | 13.5% |
| S.F. Bay Area | |||||||||
| Alameda | $738,790 | $736,870 | $645,680 | r | 0.3% | 14.4% | 19.3% | 8.0% | |
| Contra-Costa | $507,180 | $570,440 | r | $483,330 | r | -11.1% | 4.9% | 21.1% | 8.6% |
| Marin | $1,120,690 | $1,180,000 | $990,130 | -5.0% | 13.2% | 6.6% | 25.6% | ||
| Napa | $628,120 | $678,570 | $516,670 | -7.4% | 21.6% | 1.0% | 23.2% | ||
| San Francisco | $1,215,620 | $1,323,860 | $1,058,820 | r | -8.2% | 14.8% | 10.1% | 2.6% | |
| San Mateo | $1,194,000 | $1,195,000 | $980,000 | -0.1% | 21.8% | 9.5% | 13.1% | ||
| Santa Clara | $920,000 | $965,000 | $846,500 | -4.7% | 8.7% | 24.3% | 22.7% | ||
| Solano | $356,640 | $355,510 | $324,070 | 0.3% | 10.1% | 29.8% | 27.9% | ||
| Sonoma | $563,320 | $541,380 | $519,470 | 4.1% | 8.4% | 7.0% | 4.4% | ||
| Southern California | |||||||||
| Los Angeles | $502,750 | $457,870 | $464,650 | 9.8% | 8.2% | 39.9% | 10.4% | ||
| Orange | $710,940 | $711,030 | $683,490 | 0.0% | 4.0% | 26.0% | 6.0% | ||
| Riverside | $348,020 | $337,200 | $322,020 | 3.2% | 8.1% | 30.8% | 2.4% | ||
| San Bernardino | $234,080 | $236,220 | $216,020 | -0.9% | 8.4% | 26.3% | 14.2% | ||
| San Diego | $548,080 | $554,440 | $494,500 | -1.1% | 10.8% | 33.1% | 9.1% | ||
| Ventura | $601,910 | $623,400 | $569,600 | -3.4% | 5.7% | 34.4% | 9.9% | ||
| Central Coast | |||||||||
| Monterey | $517,500 | $512,500 | $430,000 | 1.0% | 20.3% | 1.0% | 4.7% | ||
| San Luis Obispo | $548,440 | $536,970 | $488,130 | 2.1% | 12.4% | 28.4% | 17.8% | ||
| Santa Barbara | $555,000 | $634,610 | $655,000 | -12.5% | -15.3% | 26.4% | 16.1% | ||
| Santa Cruz | $703,940 | $703,750 | $698,500 | 0.0% | 0.8% | 23.8% | 9.9% | ||
| Central Valley | |||||||||
| Fresno | $223,370 | $222,970 | $204,430 | 0.2% | 9.3% | 36.9% | 12.7% | ||
| Glenn | $180,000 | $186,670 | $176,670 | -3.6% | 1.9% | -22.2% | -6.7% | ||
| Kern (Bakersfield) | $215,000 | $217,000 | r | $211,250 | r | -0.9% | 1.8% | 20.3% | 3.0% |
| Kings | $202,000 | $181,250 | $195,550 | 11.4% | 3.3% | 44.6% | 30.6% | ||
| Madera | $223,330 | $229,540 | $212,500 | -2.7% | 5.1% | -21.3% | -21.3% | ||
| Merced | $208,930 | $215,000 | $178,230 | -2.8% | 17.2% | 35.4% | 8.1% | ||
| Placer | $391,960 | $398,460 | $387,500 | -1.6% | 1.2% | 25.3% | 2.6% | ||
| Sacramento | $297,600 | $292,100 | $269,350 | 1.9% | 10.5% | 30.1% | 20.1% | ||
| San Benito | $452,500 | $512,500 | $435,000 | -11.7% | 4.0% | 31.3% | -14.3% | ||
| San Joaquin | $287,250 | $292,190 | $267,070 | -1.7% | 7.6% | 51.0% | 20.6% | ||
| Stanislaus | $249,440 | $249,710 | $228,160 | -0.1% | 9.3% | 44.6% | 28.1% | ||
| Tulare | $196,210 | $175,000 | $178,620 | 12.1% | 9.8% | 65.9% | 17.6% | ||
| Other Counties in California | |||||||||
| Amador | $275,000 | $280,000 | $229,540 | -1.8% | 19.8% | 42.9% | 2.6% | ||
| Butte | $261,670 | $238,540 | $231,820 | 9.7% | 12.9% | 16.5% | 19.1% | ||
| Calaveras | $272,060 | $243,750 | $243,750 | r | 11.6% | 11.6% | 8.0% | 21.8% | |
| Del Norte | $194,000 | $258,330 | $155,000 | r | -24.9% | 25.2% | 61.5% | 40.0% | |
| El Dorado | $409,800 | $392,680 | $385,230 | 4.4% | 6.4% | 22.4% | 4.8% | ||
| Humboldt | $289,580 | $264,710 | $263,000 | 9.4% | 10.1% | 41.5% | 14.9% | ||
| Lake | $217,650 | $256,670 | $162,860 | -15.2% | 33.6% | 9.1% | 71.4% | ||
| Mariposa | $233,330 | $283,330 | $245,000 | -17.6% | -4.8% | 0.0% | -33.3% | ||
| Mendocino | $352,500 | $360,000 | $270,830 | -2.1% | 30.2% | 45.2% | 17.3% | ||
| Nevada | $355,360 | $346,000 | $314,290 | r | 2.7% | 13.1% | 13.5% | 5.2% | |
| Plumas | $283,330 | $232,140 | $233,330 | r | 22.1% | 21.4% | -35.5% | -28.6% | |
| Shasta | $235,000 | $230,300 | $208,160 | 2.0% | 12.9% | 44.2% | 7.1% | ||
| Siskiyou | $140,000 | $165,000 | $135,000 | -15.2% | 3.7% | -13.5% | -23.8% | ||
| Sutter | $241,070 | $256,670 | $200,000 | -6.1% | 20.5% | 1.7% | -7.6% | ||
| Tehama | $186,000 | $155,000 | $205,000 | r | 20.0% | -9.3% | 58.1% | 48.5% | |
| Tuolumne | $236,760 | $238,460 | $211,670 | -0.7% | 11.9% | 21.0% | 2.7% | ||
| Yolo | $361,220 | $402,170 | $344,590 | -10.2% | 4.8% | 35.8% | 28.7% | ||
| Yuba | $226,560 | $204,690 | $207,140 | 10.7% | 9.4% | 23.7% | 25.9% | ||
December 2015 County Unsold Inventory and Time on Market
(Regional and condo sales data not seasonally adjusted)
| December-15 | Unsold Inventory Index | Median Time on Market | ||||||||
| State/Region/County | Dec-15 | Nov-15 | Dec-14 | Dec-15 | Nov-15 | Dec-14 | ||||
| CA SFH (SAAR) | 2.8 | 4.2 | 3.2 | 39.5 | 37.5 | r | 44.1 | r | ||
| CA Condo/Townhomes | 2.3 | 3.4 | 2.7 | 37.2 | 34.0 | 44.0 | r | |||
| Los Angeles Metro Area | 3.3 | 4.9 | 3.8 | 54.6 | 53.4 | 56.4 | ||||
| Inland Empire | 4.1 | 5.7 | 4.6 | 57.3 | 56.1 | 58.1 | ||||
| S.F. Bay Area | 1.4 | 2.1 | r | 1.4 | 25.9 | 24.6 | 27.4 | |||
| S.F. Bay Area | ||||||||||
| Alameda | 1.1 | 2.0 | 1.2 | 20.2 | 19.2 | 22.2 | ||||
| Contra-Costa | 1.5 | 1.3 | r | 0.8 | r | 22.9 | 22.4 | r | 25.1 | r |
| Marin | 1.4 | 2.5 | 2.2 | 40.8 | 40.1 | 51.7 | ||||
| Napa | 3.2 | 4.3 | 4.2 | 55.4 | 63.9 | 63.6 | ||||
| San Francisco | 0.9 | 1.8 | 1.1 | r | 27.2 | 22.5 | 32.3 | |||
| San Mateo | 1.1 | 1.9 | 1.1 | 20.9 | 19.8 | 20.6 | ||||
| Santa Clara | 1.0 | 2.0 | 1.3 | 23.2 | 21.9 | 22.6 | ||||
| Solano | 2.1 | 3.3 | 2.8 | 44.8 | 45.9 | 54.6 | ||||
| Sonoma | 2.1 | 3.0 | 2.0 | 55.0 | 50.4 | 56.2 | ||||
| Southern California | ||||||||||
| Los Angeles | 2.8 | 4.4 | 3.4 | 48.5 | 47.3 | 50.9 | ||||
| Orange | 2.8 | 4.3 | 3.1 | 66.0 | 61.4 | 67.7 | ||||
| Riverside | 4.4 | 6.2 | 4.7 | 61.0 | 56.5 | 61.0 | ||||
| San Bernardino | 3.5 | 5.0 | 4.4 | 51.9 | 55.5 | 54.4 | ||||
| San Diego | 2.7 | 4.3 | 3.4 | 25.6 | 25.4 | 28.2 | ||||
| Ventura | 3.0 | 5.0 | 3.3 | 61.1 | 59.5 | 66.9 | ||||
| Central Coast | ||||||||||
| Monterey | 3.7 | 4.2 | 4.0 | 44.3 | 28.3 | 48.6 | ||||
| San Luis Obispo | 3.3 | 4.8 | 3.9 | 42.3 | 36.1 | 55.9 | ||||
| Santa Barbara | 3.8 | 5.5 | 4.0 | 54.1 | 49.5 | 53.1 | ||||
| Santa Cruz | 1.8 | 3.2 | 2.4 | 32.0 | 37.0 | 42.3 | ||||
| Central Valley | ||||||||||
| Fresno | 3.9 | 5.9 | 4.1 | 33.1 | 28.2 | 34.9 | ||||
| Glenn | 4.7 | 4.0 | 4.5 | 31.0 | 70.7 | 55.2 | ||||
| Kern (Bakersfield) | 3.6 | 4.7 | r | 3.3 | r | 37.0 | 40.0 | r | 35.0 | r |
| Kings | 2.6 | 4.0 | 3.7 | 27.7 | 33.9 | 42.6 | ||||
| Madera | 7.8 | 6.8 | 5.4 | 56.8 | 78.1 | 74.3 | ||||
| Merced | 3.5 | 5.5 | 3.8 | 38.6 | 52.8 | 44.8 | ||||
| Placer | 2.1 | 3.5 | 2.4 | 28.9 | 28.6 | 36.2 | ||||
| Sacramento | 1.7 | 2.8 | 2.6 | 24.8 | 23.0 | 28.1 | ||||
| San Benito | 3.3 | 4.1 | 2.5 | 28.7 | 40.7 | 41.0 | ||||
| San Joaquin | 2.3 | 4.1 | 3.1 | 26.2 | 24.8 | 29.8 | ||||
| Stanislaus | 2.4 | 4.0 | 3.2 | 27.4 | 26.0 | 27.7 | ||||
| Tulare | 3.3 | 6.2 | 3.7 | 37.8 | 38.8 | 43.3 | ||||
| Other Counties in California | ||||||||||
| Amador | 4.4 | 7.5 | 4.7 | 56.4 | 61.0 | 75.5 | ||||
| Butte | 2.9 | 4.2 | 3.6 | 42.0 | 36.2 | 48.4 | ||||
| Calaveras | 4.4 | 5.3 | 6.0 | r | 74.1 | 87.4 | 77.1 | r | ||
| Del Norte | 6.1 | 11.5 | 9.5 | r | 122.3 | 126.4 | 115.2 | r | ||
| El Dorado | 3.6 | 5.3 | 3.9 | 55.0 | 53.8 | 54.3 | ||||
| Humboldt | 2.9 | 4.8 | 4.6 | 39.5 | 54.2 | 71.0 | ||||
| Lake | 3.4 | 4.6 | 5.9 | 95.1 | 116.8 | 91.0 | ||||
| Mariposa | 9.3 | 10.4 | 6.5 | 125.8 | 105.5 | 125.8 | ||||
| Mendocino | 4.6 | 7.9 | 5.4 | 77.3 | 68.3 | 72.6 | ||||
| Nevada | 3.7 | 5.1 | 6.8 | 46.4 | 47.2 | 36.8 | ||||
| Plumas | 10.4 | 8.4 | 8.3 | r | 130.7 | 125.8 | 128.6 | r | ||
| Shasta | 4.6 | 7.6 | 4.6 | 50.2 | 55.7 | 52.3 | ||||
| Siskiyou | 7.0 | 7.9 | 7.1 | 75.5 | 79.1 | 107.3 | ||||
| Sutter | 3.3 | 3.8 | 3.5 | 41.0 | 38.9 | 44.2 | ||||
| Tehama | 3.1 | 6.4 | 5.5 | r | 53.2 | 53.8 | 69.7 | r | ||
| Tuolumne | 4.2 | 6.1 | 4.3 | 82.8 | 43.9 | 91.0 | ||||
| Yolo | 1.9 | 3.1 | 2.5 | 25.1 | 24.9 | 34.2 | ||||
| Yuba | 2.6 | 4.2 | 3.6 | 28.1 | 25.4 | 42.2 | ||||
r = revised