


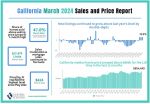


California home sales kick off year higher in January, marking best start in three years
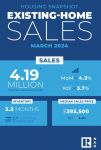
- Existing, single-family home sales totaled 383,670 in January on a seasonally adjusted annualized rate, down 5.4 percent from December and up 8.8 percent from January 2015.
- January’s statewide median home price was $468,330, down 4.3 percent from December and up 9.2 percent from January 2015.
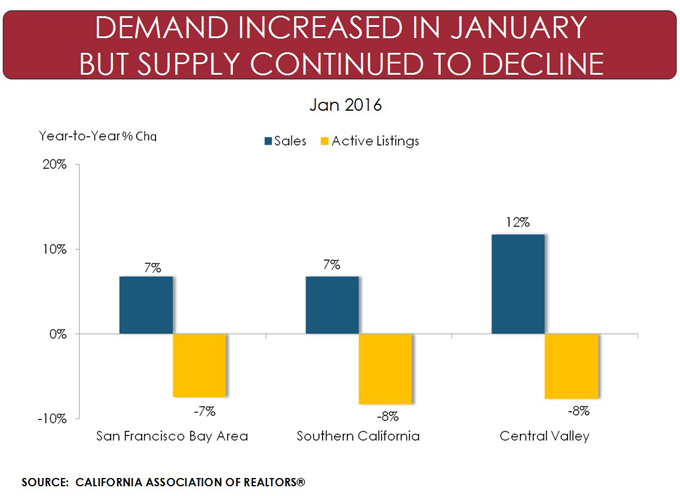
- Year-over-year sales increased in the state’s major regions, including Southern California (6.5 percent), San Francisco Bay Area (6.8 percent), and with the Central Valley posting the largest annual gain of 11.8 percent.
LOS ANGELES (Feb. 17, 2016) – California existing home sales posted their best January performance in three years as year-over-year sales recovered from delayed escrow closings late last year caused by new loan disclosure rules, the CALIFORNIA ASSOCIATION OF REALTORS® (C.A.R.) said today.
Closed escrow sales of existing, single-family detached homes in California totaled a seasonally adjusted annualized rate of 383,670 units in January, according to information collected by C.A.R. from more than 90 local REALTOR® associations and MLSs statewide. The statewide sales figure represents what would be the total number of homes sold during 2016 if sales maintained the January pace throughout the year. It is adjusted to account for seasonal factors that typically influence home sales.
The January figure was down 5.4 percent from the revised 405,760 level in December and up 8.8 percent compared with home sales in January 2015 of a revised 352,640. The January 2016 sales level was the highest since January 2013, when an annualized 421,780 homes were sold.
“While home sales increased year over year in January, they decreased minimally on a monthly basis, primarily due to a stronger than usual sales gain in December 2015, when the backlog of mortgage approvals caused by new loan disclosure rules were carried over from November,” said C.A.R. President Pat “Ziggy” Zicarelli. “Looking ahead, the slowdown should be a transitory interruption to an otherwise positive trend.”
The median price of an existing, single-family detached California home fell 4.3 percent in January to $468,330 from $489,310 in December. January’s median price was 9.2 percent higher than the revised $428,980 recorded in January 2015. The median sales price is the point at which half of homes sold for more and half sold for less; it is influenced by the types of homes selling as well as a general change in values. The year-to-year price gain was the largest since May 2014 and marks the fifth consecutive month of home price acceleration, reflecting an ongoing shift in sales activity toward higher-priced properties.
“The fundamentals underlying the demand for housing fueled a healthy start to 2016,” said C.A.R. Vice President and Chief Economist Leslie Appleton-Young. “The volatility in the equity market in the last few weeks, coupled with increasing uncertainty about the impact on economic growth, however, may lead potential home buyers and sellers to take a “wait and see” approach, which could erode housing market activity in the upcoming months.”
Other key points from C.A.R.’s January 2016 resale housing report include:
• The number of active listings increased for the first time in five months, increasing 3.1 percent from December on a statewide basis. At the regional level, total active listings increased from the previous month in Southern California (5.3 percent), and the San Francisco Bay Area (8 percent), but declined slightly in the Central Valley (1.6 percent).
• C.A.R.’s Unsold Inventory Index rose to 4.3 months in January from 2.8 months in December, primarily due to slower sales and an increase in active listings. The index stood at 4.9 months in January 2015. The index indicates the number of months needed to sell the supply of homes on the market at the current sales rate. A six- to seven-month supply is considered typical in a normal market.
• The median number of days it took to sell a single-family home increased in January to 44.5 days, compared with 39.5 days in December and 49.5 days in January 2015.
• According to C.A.R.’s sales-to-list price ratio*, properties are generally selling below the list price, except in the San Francisco Bay Area, where a lack of homes for sale is pushing sales prices higher than original asking prices. The statewide measure suggests that homes sold at a median of 97.9 percent of the list price in January, up slightly from 97.1 percent at the same time last year. The Bay Area is the only region where homes are selling above original list prices due to constrained supply with a ratio of 100.3 percent in January, up from 100 percent a year ago.
• The average price per square foot** for an existing, single-family home was $227 in January 2016, down from $230 in December and up from $212 in January 2015.
• San Francisco continued to have the highest price per square foot in January at $723/sq. ft., followed by San Mateo ($717/sq. ft.), and Santa Clara ($545/sq. ft.). The three counties with the lowest price per square foot in January were Kings ($116/sq. ft.), Siskiyou ($117/sq. ft.), and Tehama ($119/sq. ft.).
• Mortgage rates dipped in January, with the 30-year, fixed-mortgage interest rate averaging 3.87 percent, down from 3.96 percent in December and up from 3.67 percent in January 2015, according to Freddie Mac. Adjustable-mortgage interest rates also dipped, averaging 2.98 percent in January, down from 3.04 percent in December and up from 2.89 percent in January 2015.
Graphics (click links to open):
• January sales at-a-glance infographic.
• Calif. existing home sales historical.
• Share of sales by price range.
• Sales to active listings ratio by region.
• Sales to list price ratio.
• Price per square foot.
Note: The County MLS median price and sales data in the tables are generated from a survey of more than 90 associations of REALTORS® throughout the state, and represent statistics of existing single-family detached homes only. County sales data are not adjusted to account for seasonal factors that can influence home sales. Movements in sales prices should not be interpreted as changes in the cost of a standard home. The median price is where half sold for more and half sold for less; medians are more typical than average prices, which are skewed by a relatively small share of transactions at either the lower-end or the upper-end. Median prices can be influenced by changes in cost, as well as changes in the characteristics and the size of homes sold. The change in median prices should not be construed as actual price changes in specific homes.
*Sales-to-list price ratio is an indicator that reflects the negotiation power of home buyers and home sellers under current market conditions. The ratio is calculated by dividing the final sales price of a property by its last list price and is expressed as a percentage. A sales-to-list ratio with 100 percent or above suggests that the property sold for more than the list price, and a ratio below 100 percent indicates that the price sold below the asking price.
**Price per square foot is a measure commonly used by real estate agents and brokers to determine how much a square foot of space a buyer will pay for a property. It is calculated as the sale price of the home divided by the number of finished square feet. C.A.R. currently tracks price-per-square foot statistics for 38 counties.
Leading the way…® in California real estate for more than 110 years, the CALIFORNIA ASSOCIATION OF REALTORS® (www.car.org) is one of the largest state trade organizations in the United States with 185,000 members dedicated to the advancement of professionalism in real estate. C.A.R. is headquartered in Los Angeles.
January 2016 County Sales and Price Activity
(Regional and condo sales data not seasonally adjusted)
| January-16 | Median Sold Price of Existing Single-Family Homes | Sales | |||||||
| State/Region/County | Jan-16 | Dec-15 | Jan-15 | MTM% Chg | YTY% Chg | MTM% Chg | YTY% Chg | ||
| CA SFH (SAAR) | $468,330 | $489,310 | $428,980 | r | -4.3% | 9.2% | -5.4% | 8.8% | |
| CA Condo/Townhomes | $380,710 | $394,070 | r | $351,790 | r | -3.4% | 8.2% | -32.5% | 1.4% |
| Los Angeles Metro Area | $432,080 | $446,660 | $395,200 | -3.3% | 9.3% | -28.1% | 7.3% | ||
| Inland Empire | $291,920 | $300,130 | $267,070 | -2.7% | 9.3% | -23.1% | 6.9% | ||
| S.F. Bay Area | $703,150 | $728,950 | $610,180 | r | -3.5% | 15.2% | -39.0% | 6.8% | |
| S.F. Bay Area | |||||||||
| Alameda | $711,900 | $738,790 | $610,130 | r | -3.6% | 16.7% | -41.6% | 2.1% | |
| Contra-Costa | $499,550 | $507,180 | $442,440 | r | -1.5% | 12.9% | -38.2% | -2.2% | |
| Marin | $955,360 | $1,120,690 | $982,140 | -14.8% | -2.7% | -44.4% | 5.9% | ||
| Napa | $610,000 | $628,120 | $500,000 | r | -2.9% | 22.0% | -22.8% | 18.2% | |
| San Francisco | $1,173,610 | $1,215,620 | $986,610 | -3.5% | 19.0% | -48.7% | 6.3% | ||
| San Mateo | $1,077,500 | $1,194,000 | $1,012,500 | -9.8% | 6.4% | -37.9% | 25.0% | ||
| Santa Clara | $895,000 | $920,000 | $815,000 | -2.7% | 9.8% | -39.6% | 9.5% | ||
| Solano | $361,670 | $356,640 | $326,510 | 1.4% | 10.8% | -36.7% | 6.0% | ||
| Sonoma | $593,750 | $563,320 | $468,180 | 5.4% | 26.8% | -34.5% | 17.8% | ||
| Southern California | |||||||||
| Los Angeles | $480,950 | $502,750 | $441,610 | -4.3% | 8.9% | -33.0% | 5.2% | ||
| Orange | $704,950 | $710,940 | $674,340 | -0.8% | 4.5% | -24.6% | 15.2% | ||
| Riverside | $333,370 | $348,020 | $306,060 | -4.2% | 8.9% | -23.8% | 7.7% | ||
| San Bernardino | $234,460 | $234,080 | $206,660 | 0.2% | 13.5% | -21.9% | 5.7% | ||
| San Diego | $542,150 | $548,080 | $496,380 | -1.1% | 9.2% | -32.1% | 2.9% | ||
| Ventura | $638,590 | $601,910 | $582,630 | 6.1% | 9.6% | -32.0% | 3.7% | ||
| Central Coast | |||||||||
| Monterey | $500,000 | $520,000 | r | $420,000 | -3.8% | 19.0% | -19.0% | -3.6% | |
| San Luis Obispo | $525,000 | $548,440 | $478,720 | -4.3% | 9.7% | -31.0% | -2.6% | ||
| Santa Barbara | $712,960 | $555,000 | $690,220 | 28.5% | 3.3% | -20.9% | 20.3% | ||
| Santa Cruz | $694,500 | $703,940 | $665,000 | -1.3% | 4.4% | -38.5% | 1.1% | ||
| Central Valley | |||||||||
| Fresno | $213,510 | $223,370 | $211,470 | -4.4% | 1.0% | -24.5% | 19.6% | ||
| Glenn | $160,000 | $180,000 | $162,500 | -11.1% | -1.5% | 28.6% | -14.3% | ||
| Kern (Bakersfield) | $215,000 | $215,000 | $195,000 | 0.0% | 10.3% | -17.0% | 10.8% | ||
| Kings | $194,280 | $202,000 | $172,500 | -3.8% | 12.6% | -53.2% | 0.0% | ||
| Madera | $222,730 | $223,330 | $245,000 | -0.3% | -9.1% | -4.2% | 24.3% | ||
| Merced | $192,000 | $208,930 | $168,750 | -8.1% | 13.8% | -23.4% | 30.2% | ||
| Placer | $410,000 | $391,960 | $375,980 | 4.6% | 9.0% | -32.8% | 11.8% | ||
| Sacramento | $282,280 | $297,600 | $256,670 | -5.1% | 10.0% | -39.2% | 4.6% | ||
| San Benito | $480,000 | $452,500 | $435,000 | 6.1% | 10.3% | 14.3% | 37.1% | ||
| San Joaquin | $293,840 | $287,250 | $263,360 | 2.3% | 11.6% | -21.5% | 32.0% | ||
| Stanislaus | $244,550 | $249,440 | $230,790 | -2.0% | 6.0% | -34.1% | 0.6% | ||
| Tulare | $193,750 | $196,210 | $173,330 | -1.3% | 11.8% | -42.9% | 6.5% | ||
| Other Counties in California | |||||||||
| Amador | $225,000 | $275,000 | $210,710 | -18.2% | 6.8% | -25.0% | 30.4% | ||
| Butte | $260,580 | $261,670 | $231,730 | -0.4% | 12.4% | -26.5% | 7.2% | ||
| Calaveras | $255,560 | $272,060 | $228,120 | r | -6.1% | 12.0% | -47.4% | -9.1% | |
| Del Norte | $156,670 | $194,000 | $160,000 | r | -19.2% | -2.1% | -9.5% | 5.6% | |
| El Dorado | $408,330 | $409,800 | $375,000 | -0.4% | 8.9% | -25.4% | 14.0% | ||
| Humboldt | $248,080 | $289,580 | $263,890 | -14.3% | -6.0% | -38.8% | 10.9% | ||
| Lake | $236,760 | $217,650 | $163,330 | 8.8% | 45.0% | -46.9% | 6.3% | ||
| Mariposa | $287,500 | $233,330 | $268,750 | 23.2% | 7.0% | 50.0% | 66.7% | ||
| Mendocino | $354,170 | $352,500 | $258,330 | 0.5% | 37.1% | -52.5% | 0.0% | ||
| Nevada | $350,000 | $355,360 | $339,290 | r | -1.5% | 3.2% | -38.6% | -24.4% | |
| Plumas | $337,500 | $283,330 | $275,000 | r | 19.1% | 22.7% | -5.0% | 90.0% | |
| Shasta | $229,310 | $235,000 | $216,130 | -2.4% | 6.1% | -37.8% | 2.9% | ||
| Siskiyou | $197,500 | $140,000 | $195,000 | 41.1% | 1.3% | -3.1% | 24.0% | ||
| Sutter | $217,860 | $241,070 | $227,080 | -9.6% | -4.1% | -14.8% | -1.9% | ||
| Tehama | $190,000 | $186,000 | $164,290 | r | 2.2% | 15.6% | -61.2% | -38.7% | |
| Tuolumne | $211,670 | $236,760 | $236,360 | -10.6% | -10.4% | -24.0% | 23.9% | ||
| Yolo | $360,420 | $361,220 | $307,500 | -0.2% | 17.2% | -35.8% | 33.8% | ||
| Yuba | $207,350 | $226,560 | $204,170 | -8.5% | 1.6% | -13.7% | 43.2% | ||
r = revised
January 2016 County Unsold Inventory and Time on Market
(Regional and condo sales data not seasonally adjusted)
| January-16 | Unsold Inventory Index | Median Time on Market | ||||||||
| State/Region/County | Jan-16 | Dec-15 | Jan-15 | Jan-16 | Dec-15 | Jan-15 | ||||
| CA SFH (SAAR) | 4.3 | 2.8 | 4.9 | r | 44.5 | 39.5 | 49.5 | |||
| CA Condo/Townhomes | 3.8 | 2.3 | 4.1 | r | 40.7 | 37.2 | 49.1 | |||
| Los Angeles Metro Area | 4.8 | 3.3 | 5.5 | 57.3 | 54.6 | 63.0 | ||||
| Inland Empire | 5.7 | 4.1 | 6.4 | 61.9 | 57.3 | 67.5 | ||||
| S.F. Bay Area | 2.4 | 1.4 | 2.6 | r | 28.1 | 25.9 | 29.5 | |||
| S.F. Bay Area | ||||||||||
| Alameda | 2.0 | 1.1 | 2.3 | r | 22.5 | 20.2 | 23.3 | |||
| Contra-Costa | 2.5 | 1.5 | 1.4 | r | 24.3 | 22.9 | 27.7 | |||
| Marin | 2.8 | 1.4 | 4.0 | 45.5 | 40.8 | 51.9 | ||||
| Napa | 4.1 | 3.2 | 5.4 | 65.1 | 55.4 | 73.1 | ||||
| San Francisco | 2.3 | 0.9 | 2.6 | 33.9 | 27.2 | 29.1 | ||||
| San Mateo | 1.9 | 1.1 | 2.5 | 22.1 | 20.9 | 22.5 | ||||
| Santa Clara | 1.9 | 1.0 | 2.3 | 23.6 | 23.2 | 25.4 | ||||
| Solano | 3.4 | 2.1 | 4.2 | 50.0 | 44.8 | 50.5 | ||||
| Sonoma | 3.2 | 2.1 | 3.9 | 65.6 | 55.0 | 63.8 | ||||
| Southern California | ||||||||||
| Los Angeles | 4.3 | 2.8 | 4.9 | 51.2 | 48.5 | 54.8 | ||||
| Orange | 4.1 | 2.8 | 5.1 | 64.2 | 66.0 | 71.9 | ||||
| Riverside | 6.3 | 4.4 | 7.1 | 64.5 | 61.0 | 70.0 | ||||
| San Bernardino | 4.8 | 3.5 | 5.4 | 57.0 | 51.9 | 63.5 | ||||
| San Diego | 4.3 | 2.7 | 5.0 | 27.0 | 25.6 | 35.0 | ||||
| Ventura | 4.8 | 3.0 | 5.2 | 72.2 | 61.1 | 72.6 | ||||
| Central Coast | ||||||||||
| Monterey | 4.7 | 3.7 | 4.7 | 51.5 | 44.3 | 42.0 | ||||
| San Luis Obispo | 5.1 | 3.3 | 5.0 | 43.4 | 42.3 | 37.9 | ||||
| Santa Barbara | 4.9 | 3.8 | 5.4 | 51.4 | 54.1 | 54.9 | ||||
| Santa Cruz | 2.8 | 1.8 | 3.9 | 38.6 | 32.0 | 46.0 | ||||
| Central Valley | ||||||||||
| Fresno | 5.1 | 3.9 | 6.1 | 32.0 | 33.1 | 42.4 | ||||
| Glenn | 3.1 | 4.7 | 2.7 | 24.7 | 31.0 | 82.8 | ||||
| Kern (Bakersfield) | 4.7 | 3.5 | r | 4.8 | r | 41.0 | 37.0 | 42.0 | ||
| Kings | 6.1 | 2.6 | 6.6 | 31.0 | 27.7 | 50.3 | ||||
| Madera | 7.8 | 7.8 | 9.5 | 78.4 | 56.8 | 58.2 | ||||
| Merced | 4.7 | 3.5 | 6.6 | 55.5 | 38.6 | 48.6 | ||||
| Placer | 3.5 | 2.1 | 4.7 | 27.5 | 28.9 | 42.7 | ||||
| Sacramento | 3.0 | 1.7 | 3.9 | 26.6 | 24.8 | 34.2 | ||||
| San Benito | 2.4 | 3.3 | 3.8 | 35.5 | 28.7 | 52.2 | ||||
| San Joaquin | 3.1 | 2.3 | 4.6 | 28.9 | 26.2 | 39.3 | ||||
| Stanislaus | 3.7 | 2.4 | 4.1 | 31.5 | 27.4 | 32.9 | ||||
| Tulare | 6.4 | 3.3 | 6.3 | 43.3 | 37.8 | 49.7 | ||||
| Other Counties in California | ||||||||||
| Amador | 6.3 | 4.4 | 7.4 | 91.0 | 56.4 | 115.2 | ||||
| Butte | 3.9 | 2.9 | 4.7 | 55.7 | 42.0 | 50.5 | ||||
| Calaveras | 8.1 | 4.4 | 8.9 | r | 86.8 | 74.1 | 48.1 | |||
| Del Norte | 6.7 | 6.1 | 8.6 | r | 122.5 | 122.3 | 126.3 | |||
| El Dorado | 4.7 | 3.6 | 6.0 | 53.8 | 55.0 | 79.9 | ||||
| Humboldt | 4.9 | 2.9 | 7.5 | 41.2 | 39.5 | 56.8 | ||||
| Lake | 6.8 | 3.4 | 6.9 | 82.3 | 95.1 | 103.4 | ||||
| Mariposa | 6.1 | 9.3 | 12.0 | 98.3 | 125.8 | 68.3 | ||||
| Mendocino | 10.2 | 4.6 | 10.2 | 112.8 | 77.3 | 123.7 | ||||
| Nevada | 6.0 | 3.7 | 6.0 | 61.0 | 46.4 | 62.7 | ||||
| Plumas | 10.0 | 10.4 | 25.8 | r | 132.8 | 130.7 | 131.9 | |||
| Shasta | 7.7 | 4.6 | 7.4 | 51.9 | 50.2 | 71.2 | r | |||
| Siskiyou | 7.3 | 7.0 | 12.8 | 78.4 | 75.5 | 122.1 | ||||
| Sutter | 4.1 | 3.3 | 4.4 | 27.9 | 41.0 | 78.7 | ||||
| Tehama | 9.0 | 3.1 | 5.5 | r | 82.8 | 53.2 | 54.6 | r | ||
| Tuolumne | 5.1 | 4.2 | 7.2 | 98.3 | 82.8 | 50.3 | ||||
| Yolo | 3.0 | 1.9 | 4.3 | 31.5 | 25.1 | 45.5 | ||||
| Yuba | 3.2 | 2.6 | 4.9 | 29.5 | 28.1 | 37.2 | ||||
r = revised
Source: C.A.R.