
April California pending home sales trend higher but inventory concerns remain
May 26, 2016 - LOS ANGELES – Led by the Central Valley, California statewide pending home sales reversed a three-month decline and posted higher in April, but a persistent shortage of homes for sale may dampen the upcoming spring homebuying season, the CALIFORNIA ASSOCIATION OF REALTORS® (C.A.R.) said on Monday.
C.A.R.’s April Market Pulse Survey** also reflected a slowdown in market activity with a decrease in floor calls, open house traffic, and listing appointments/client presentations, likely due to the tight inventory and low affordability conditions constraining the California housing market.
Pending home sales data:
• Statewide pending home sales rose in April on an annual basis, with the Pending Home Sales Index (PHSI)* increasing 4.1 percent from 135.9 in April 2015 to 141.6 in April 2016, based on signed contracts. April’s annual increase was the strongest thus far this year, and the PHSI is now at its highest level since March 2012.
• California pending home sales also rose on a monthly basis more than is typical for April, which average 1.3 percent between 2008 and 2015. The PHSI increased 4.5 percent from an index of 135.4 in March. When adjusting pending sales for typical seasonal patterns, pending sales actually increased 9 percent from March. Despite the uptick, inventory concerns remain as statewide listings are 4.2 percent below where they were a year ago.
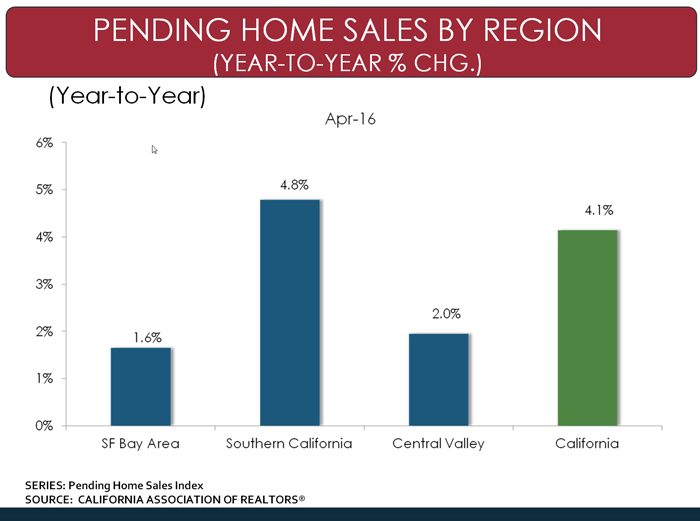
• At the regional level, pending sales were up on an annual basis in all major regions of the state, with the Central Valley Region’s index reaching an all-time high, thanks to its high affordability and ample inventory. The Southern California region also saw a healthy uptick in pending sales from a year ago, driven by double-digit increases in Orange County and Riverside.
• For the Bay Area as a whole, pending sales were down 5.1 percent from March and up 1.6 percent from April 2015. Within the core areas of the Bay Area, including San Francisco and Santa Clara counties, pending sales actually saw an increase over last year of 9.4 percent and 15.8 percent, respectively.
• The pending sales index in Central Valley posted an increase of 35.3 percent from March and 2 percent from April 2015.
• While pending home sales in Southern California as a whole were down 5.5 percent from March, they rose 4.8 percent from a year ago. Los Angeles County posted an annual gain of 3.4 percent, while Orange County experienced a robust 10.3 percent gain.
Year-to-Year Change in Pending Sales by County/Region
| County/Region/State | Apr-16 | Apr-15 | Yearly % Change |
| Los Angeles | 94.2 | 91.1 | 3.4% |
| Monterey | 80.2 | 70.5 | 13.7% |
| Orange | 87.6 | 79.4 | 10.3% |
| Sacramento | 81.8 | 81.9 | -0.2% |
| San Francisco | 96.7 | 88.4 | 9.4% |
| Santa Clara | 115.6 | 99.8 | 15.8% |
| SF Bay Area | 170.0 | 167.3 | 1.6% |
| So. CA | 108.7 | 103.8 | 4.8% |
| Central Valley | 130.2 | 127.7 | 2.0% |
| California | 141.6 | 135.9 | 4.1% |
April REALTOR® Market Pulse Survey**:
In a separate report, California REALTORS® responding to C.A.R.’s April Market Pulse Survey saw a decrease in floor calls, open house traffic, and listing appointments/client presentations, likely due to the tight inventory and low affordability conditions constraining the California housing market. Floor calls and listing appointments both reversed three months’ growth in April. Open house traffic declined also but has been in positive territory since the beginning of the year.
• The share of homes selling above asking price in April shrank for the first time since December 2015, slipping to 32 percent from 34 percent in March and 36 percent in April 2015. Conversely, the share of properties selling below asking price rose for the first time in four months to 40 percent. The remainder (28 percent) sold at asking price.
• For the homes that sold above asking price, the premium paid over asking price declined for the second straight month to an average of 9.6 percent, down from March’s 9.8 percent and 10 percent in April 2015.
• The 40 percent of homes that sold below asking price sold for an average of 12 percent below asking price in April, down from 9.6 percent in March and 11 percent a year ago.
• Nearly seven of 10 properties for sale received multiple offers in April, indicating the market remains competitive. Seventy-two percent of properties received multiple offers in April 2015.
• The average number of offers per property decreased for the first time in three months to 2.9 in April, down from 3.3 in March and 3.6 in April 2015.
• With home prices leveling off in recent months, more sellers are adjusting their listing price to become more in line with buyers’ expectations. About one in four (23 percent) of properties had price reductions in April, down from 28 percent a year ago.
• Low housing inventory continued to be REALTORS®’ biggest concerns, cited by one in three (33 percent), while 16 percent indicated declining housing affordability, and 14 percent stated overinflated home prices.
• REALTORS® remained somewhat optimistic about market conditions over the next year, with the index increasing slightly from 60 in March to 61 in April. However, optimism is waning as the index is down from 73 a year ago, indicating fewer REALTOR® respondents are positive about the market.
Graphics (click links to open):
• Pending home sales by region.
• Homes selling at or above asking price.
• Share of homes receiving multiple offers.
• REALTORS®’ market expectations.
*Note: C.A.R.’s pending sales information is generated from a survey of more than 70 associations of REALTORS® and MLSs throughout the state. Pending home sales are forward-looking indicators of future home sales activity, offering solid information on future changes in the direction of the market. A sale is listed as pending after a seller has accepted a sales contract on a property. The majority of pending home sales usually becomes closed sales transactions one to two months later. The year 2008 was used as the benchmark for the Pending Homes Sales Index. An index of 100 is equal to the average level of contract activity during 2008.
**C.A.R.’s Market Pulse Survey is a monthly online survey of more than 300 California REALTORS® to measure data about their last closed transaction and sentiment about business activity in their market area for the previous month.
Leading the way...® in California real estate for more than 110 years, the CALIFORNIA ASSOCIATION OF REALTORS® (www.car.org) is one of the largest state trade organizations in the United States with 185,000 members dedicated to the advancement of professionalism in real estate. C.A.R. is headquartered in Los Angeles.
Source: CAR