
Statewide median home price continues to climb; above $500,000 for second straight month
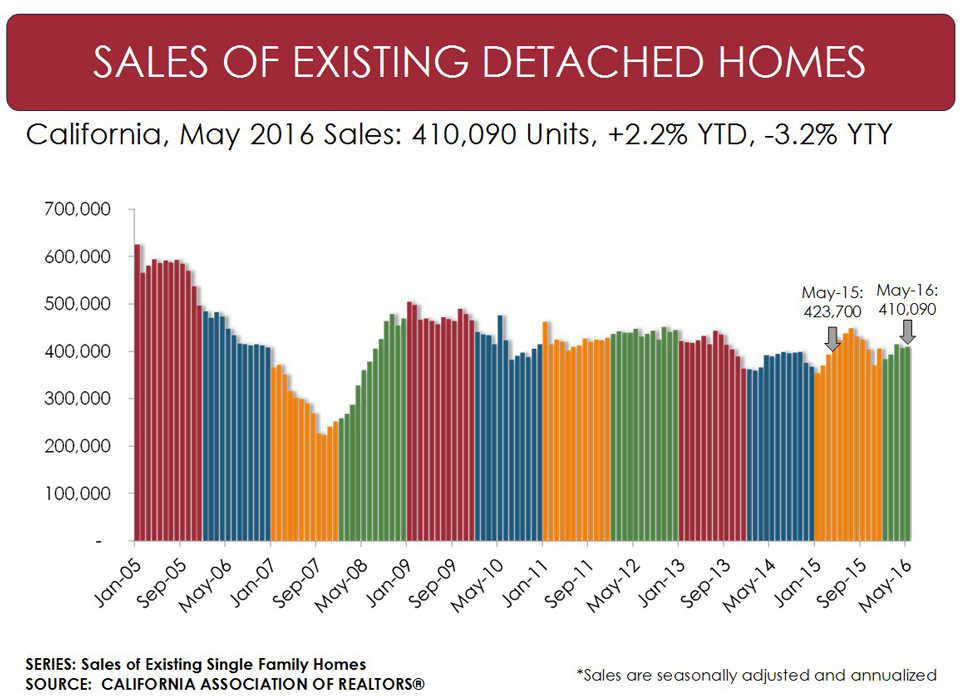
- Existing, single-family home sales totaled 410,090 in May on a seasonally adjusted annualized rate, up 0.6 percent from April and down 3.2 percent from May 2015.
- May’s statewide median home price was $518,760, up 1.8 percent from April and 6.3 percent from May 2015.
- Year-to-date home sales are 2.2 percent higher than a year ago.
June 20, 2016 - LOS ANGELES – California existing home sales edged up in May, rising above the 400,000 benchmark level for the third straight month, while strained housing supply continued to push prices higher, the CALIFORNIA ASSOCIATION OF REALTORS® (C.A.R.) said today.
Closed escrow sales of existing, single-family detached homes in California totaled a seasonally adjusted annualized rate of 410,090 units in May, according to information collected by C.A.R. from more than 90 local REALTOR® associations and MLSs statewide. The statewide sales figure represents what would be the total number of homes sold during 2016 if sales maintained the May pace throughout the year. It is adjusted to account for seasonal factors that typically influence home sales.
The May figure was up a slight 0.6 percent from the revised 407,560 level in April and down 3.2 percent compared with home sales in May 2015 of a revised 423,700. The year-to-year decline was the first back-to-back sales decline since November 2014.
“While May home sales edged up slightly, we are seeing a moderation, driven by tight housing inventory and reduced affordability,” said C.A.R. President Pat “Ziggy” Zicarelli. “Affordable areas, such as the Inland Empire and Central Valley, where housing supply is relatively more abundant, are outperforming the San Francisco Bay Area, where thin housing availability is hampering home sales. In fact, eight of that region’s nine counties experienced a sales decline from the previous year.”
A change in the mix of sales and a continued mismatch between supply and demand pushed the median price of an existing, single-family detached California home 1.8 percent higher in May to $518,760 from $509,590 in April. May’s median price was 6.3 percent higher than the revised $487,960 recorded in May 2015. The median sales price is the point at which half of homes sold for more and half sold for less; it is influenced by the types of homes selling as well as a general change in values. May marked the second consecutive month that the median price was above $500,000; it is still below the pre-recession peak of $594,530 reached in May 2007.
“The California housing market is growing modestly so far this year, with home sales running 2 percent higher year to date,” said C.A.R. Vice President and Chief Economist Leslie Appleton-Young. “Fundamental drivers, such as household formation and economic growth will continue to move housing demand forward. However, constrained inventory, low affordability, and regional disparities will be a drag on this year’s market outlook, which is forecast to see a 1.3 percent growth in sales and a 5 percent increase in the median home price.”
Other key points from C.A.R.’s May 2016 resale housing report include:
• C.A.R.’s Unsold Inventory Index, which indicates the number of months needed to sell the supply of homes on the market at the current sales rate, dipped slightly to 3.4 months in May from 3.5 months in April. The index stood at 3.5 months in May 2015. The year-over-year dip was due primarily to a drop in inventory as overall active listings increased 5.8 percent from April 2016. The long-run average home supply is 6.1 months, indicating inventory levels are running at roughly 60 percent of normal.
• The median number of days it took to sell a single-family home slipped in May to 27.3 days, compared with 27.7 days in April and 27.9 days in May 2015.
• According to C.A.R.’s sales-to-list price ratio*, tight inventories also appear to be driving final sales prices closer to listing prices, with sales prices rising to 99.7 percent of listing prices statewide in May from 99.3 percent in April.
• The average price per square foot** for an existing, single-family home statewide was $249 in May 2016, up from $244 in April and $238 in May 2015.
• San Francisco County had the highest price per square foot in May at $856/sq. ft., followed by San Mateo ($826/sq. ft.), and Santa Clara counties ($638/sq. ft.). The counties with the lowest price per square foot in May include Siskiyou ($121/sq. ft.), Madera ($123/sq. ft.), and Plumas ($125/sq. ft.).
• Mortgage rates were essentially flat in May, with the 30-year, fixed-mortgage interest rate averaging 3.60 percent, compared with 3.61 percent in April and 3.84 percent in May 2015, according to Freddie Mac. Adjustable-mortgage interest rates slipped, averaging 2.81 percent in May, down from 2.83 percent in April and 2.89 percent in May 2015.
Graphics (click links to open):
• May sales at-a-glance infographic.
• Calif. existing home sales historical.
• Share of sales by price range.
• Historical condo sales.
• CA sales to list price ratio.
• CA price per square foot.
Note: The County MLS median price and sales data in the tables are generated from a survey of more than 90 associations of REALTORS® throughout the state, and represent statistics of existing single-family detached homes only. County sales data are not adjusted to account for seasonal factors that can influence home sales. Movements in sales prices should not be interpreted as changes in the cost of a standard home. The median price is where half sold for more and half sold for less; medians are more typical than average prices, which are skewed by a relatively small share of transactions at either the lower-end or the upper-end. Median prices can be influenced by changes in cost, as well as changes in the characteristics and the size of homes sold. The change in median prices should not be construed as actual price changes in specific homes.
*Sales-to-list price ratio is an indicator that reflects the negotiation power of home buyers and home sellers under current market conditions. The ratio is calculated by dividing the final sales price of a property by its last list price and is expressed as a percentage. A sales-to-list ratio with 100 percent or above suggests that the property sold for more than the list price, and a ratio below 100 percent indicates that the price sold below the asking price.
**Price per square foot is a measure commonly used by real estate agents and brokers to determine how much a square foot of space a buyer will pay for a property. It is calculated as the sale price of the home divided by the number of finished square feet. C.A.R. currently tracks price-per-square foot statistics for 38 counties.
Leading the way…® in California real estate for more than 110 years, the CALIFORNIA ASSOCIATION OF REALTORS® (www.car.org) is one of the largest state trade organizations in the United States with 185,000 members dedicated to the advancement of professionalism in real estate. C.A.R. is headquartered in Los Angeles.
May 2016 County Sales and Price Activity
(Regional and condo sales data not seasonally adjusted)
| May-16 | Median Sold Price of Existing Single-Family Homes | Sales | |||||||
| State/Region/County | May-16 | Apr-16 | May-15 | MTM% Chg | YTY% Chg | MTM% Chg | YTY% Chg | ||
| CA SFH (SAAR) | $518,760 | $509,590 | r | $487,960 | r | 1.8% | 6.3% | 0.6% | -3.2% |
| CA Condo/Townhomes | $410,680 | $408,880 | r | $389,880 | r | 0.4% | 5.3% | 4.9% | 0.8% |
| Los Angeles Metro Area | $469,890 | $459,110 | $440,050 | 2.3% | 6.8% | 5.0% | 1.9% | ||
| Inland Empire | $315,980 | $310,830 | r | $288,960 | 1.7% | 9.4% | 5.3% | 4.5% | |
| S.F. Bay Area | $848,583 | $831,182 | r | $772,558 | r | 2.1% | 9.8% | 11.2% | -5.1% |
| S.F. Bay Area | |||||||||
| Alameda | $843,360 | $820,080 | $763,740 | r | 2.8% | 10.4% | 13.2% | -8.2% | |
| Contra-Costa | $633,620 | $590,410 | $557,060 | r | 7.3% | 13.7% | 14.2% | -9.6% | |
| Marin | $1,243,590 | $1,195,830 | r | $1,148,650 | r | 4.0% | 8.3% | 5.2% | -3.4% |
| Napa | $666,670 | $651,960 | r | $610,800 | r | 2.3% | 9.1% | 2.0% | -12.6% |
| San Francisco | $1,409,370 | $1,408,330 | $1,375,000 | 0.1% | 2.5% | -3.5% | -4.5% | ||
| San Mateo | $1,385,000 | $1,309,000 | r | $1,330,000 | 5.8% | 4.1% | 21.1% | 1.0% | |
| Santa Clara | $1,100,000 | $1,085,000 | $993,000 | 1.4% | 10.8% | 8.8% | -1.3% | ||
| Solano | $382,080 | $384,470 | r | $360,140 | r | -0.6% | 6.1% | 9.9% | -2.8% |
| Sonoma | $620,810 | $595,730 | r | $567,880 | r | 4.2% | 9.3% | 11.7% | -5.4% |
| Southern California | |||||||||
| Los Angeles | $467,040 | $457,720 | $432,570 | 2.0% | 8.0% | 7.9% | -1.2% | ||
| Orange | $735,910 | $734,650 | $717,850 | 0.2% | 2.5% | 9.7% | 4.3% | ||
| Riverside | $353,900 | $354,020 | $332,490 | 0.0% | 6.4% | 9.4% | 6.0% | ||
| San Bernardino | $245,080 | $236,850 | $220,890 | 3.5% | 11.0% | -1.6% | 1.9% | ||
| San Diego | $591,800 | $583,490 | $538,660 | 1.4% | 9.9% | 3.9% | 4.2% | ||
| Ventura | $631,140 | $630,100 | $620,460 | 0.2% | 1.7% | 11.2% | 1.9% | ||
| Central Coast | |||||||||
| Monterey | $540,000 | $529,900 | $530,000 | 1.9% | 1.9% | -3.4% | -2.2% | ||
| San Luis Obispo | $558,750 | $552,835 | $498,147 | 1.1% | 12.2% | -0.7% | 11.4% | ||
| Santa Barbara | $655,170 | $709,820 | $820,120 | r | -7.7% | -20.1% | 11.7% | -5.2% | |
| Santa Cruz | $800,000 | $775,500 | $684,500 | 3.2% | 16.9% | 3.1% | -11.2% | ||
| Central Valley | |||||||||
| Fresno | $231,370 | $230,590 | $216,110 | 0.3% | 7.1% | 2.7% | 7.5% | ||
| Glenn | $176,670 | $225,000 | $170,000 | -21.5% | 3.9% | -38.9% | -45.0% | ||
| Kern | $226,800 | $218,220 | $228,600 | r | 3.9% | -0.8% | 4.0% | -6.9% | |
| Kings | $216,410 | $208,750 | $183,330 | 3.7% | 18.0% | 21.2% | 35.5% | ||
| Madera | $214,280 | $215,480 | $222,060 | -0.6% | -3.5% | -11.1% | 30.9% | ||
| Merced | $220,690 | $208,330 | $203,570 | 5.9% | 8.4% | 22.8% | 7.8% | ||
| Placer | $433,140 | $435,800 | $403,420 | -0.6% | 7.4% | 4.8% | 0.4% | ||
| Sacramento | $323,000 | $313,360 | $293,480 | 3.1% | 10.1% | 3.4% | 4.5% | ||
| San Benito | $479,000 | $479,000 | $444,990 | 0.0% | 7.6% | -4.1% | -4.1% | ||
| San Joaquin | $319,190 | $307,880 | $280,000 | 3.7% | 14.0% | 9.6% | -2.3% | ||
| Stanislaus | $267,000 | $267,420 | $245,570 | -0.2% | 8.7% | 1.3% | -11.9% | ||
| Tulare | $205,260 | $205,740 | $188,790 | -0.2% | 8.7% | 24.0% | 18.8% | ||
| Other Counties in California | |||||||||
| Amador | $277,270 | $241,670 | $233,330 | 14.7% | 18.8% | -8.3% | -4.3% | ||
| Butte | $275,000 | $272,220 | $261,110 | 1.0% | 5.3% | 30.1% | 11.5% | ||
| Calaveras | $290,380 | $280,550 | $296,870 | 3.5% | -2.2% | 18.2% | 8.3% | ||
| Del Norte | $190,000 | $307,140 | $170,000 | -38.1% | 11.8% | 69.2% | 15.8% | ||
| El Dorado | $437,880 | $426,410 | $436,510 | 2.7% | 0.3% | 13.4% | 3.2% | ||
| Humboldt | $270,590 | $288,890 | $250,000 | -6.3% | 8.2% | -3.8% | -3.8% | ||
| Lake | $244,230 | $243,180 | $217,190 | 0.4% | 12.4% | 3.0% | -8.0% | ||
| Mariposa | $275,000 | $250,000 | $250,000 | 10.0% | 10.0% | 41.7% | -22.7% | ||
| Mendocino | $342,100 | $364,290 | r | $317,860 | r | -6.1% | 7.6% | 42.9% | 17.6% |
| Nevada | $358,140 | $325,000 | $340,620 | 10.2% | 5.1% | 21.3% | -6.6% | ||
| Plumas | $225,000 | $258,330 | $205,000 | r | -12.9% | 9.8% | 155.6% | -25.8% | |
| Shasta | $230,500 | $232,090 | $231,030 | -0.7% | -0.2% | -3.4% | 7.9% | ||
| Siskiyou | $174,000 | $166,670 | $145,000 | 4.4% | 20.0% | 2.5% | 13.9% | ||
| Sutter | $240,520 | $235,420 | $218,060 | 2.2% | 10.3% | -20.6% | 8.5% | ||
| Tehama | $175,710 | $185,000 | $186,000 | -5.0% | -5.5% | 32.3% | -4.7% | ||
| Tuolumne | $246,660 | $261,540 | $241,670 | -5.7% | 2.1% | 13.8% | 10.0% | ||
| Yolo | $392,860 | $415,280 | $393,180 | -5.4% | -0.1% | 16.3% | 3.0% | ||
| Yuba | $216,250 | $233,820 | $219,440 | -7.5% | -1.5% | 10.1% | 13.0% | ||
May 2016 County Unsold Inventory and Time on Market
(Regional and condo sales data not seasonally adjusted)
| May-16 | Unsold Inventory Index | Median Time on Market | ||||||||
| State/Region/County | May-16 | Apr-16 | May-15 | May-16 | Apr-16 | May-15 | ||||
| CA SFH (SAAR) | 3.4 | 3.5 | 3.5 | 27.3 | 27.7 | 27.9 | r | |||
| CA Condo/Townhomes | 2.8 | 2.8 | 2.8 | 27.3 | 26.7 | 29.0 | r | |||
| Los Angeles Metropolitan Area | 4.1 | 4.0 | 3.0 | r | 45.8 | 44.5 | 34.2 | |||
| Inland Empire | 4.3 | 4.2 | r | 3.1 | r | 48.9 | 45.0 | 32.7 | ||
| S.F. Bay Area | 2.4 | 2.4 | r | 2.3 | 36.0 | 33.3 | 36.6 | r | ||
| S.F. Bay Area | ||||||||||
| Alameda | 2.2 | 2.3 | 1.9 | 17.5 | 17.3 | 17.6 | ||||
| Contra-Costa | 2.4 | 2.5 | 1.2 | r | 18.0 | 18.1 | 18.6 | |||
| Marin | 2.8 | 2.8 | 2.4 | r | 25.2 | 26.5 | r | 27.3 | r | |
| Napa | 5.0 | 4.9 | r | 4.4 | 42.0 | 47.8 | r | 46.7 | r | |
| San Francisco | 2.5 | 2.3 | 1.8 | 21.1 | 22.9 | 19.2 | ||||
| San Mateo | 2.0 | 2.3 | 1.7 | 17.8 | 17.6 | 17.1 | ||||
| Santa Clara | 2.1 | 2.1 | 1.8 | 17.9 | 17.8 | 17.5 | ||||
| Solano | 2.7 | 2.8 | r | 3.3 | r | 34.3 | 37.5 | r | 37.2 | r |
| Sonoma | 3.2 | 3.2 | 3.2 | r | 40.8 | 41.1 | 41.4 | r | ||
| Southern California | ||||||||||
| Los Angeles | 3.6 | 3.5 | 3.6 | 40.5 | 39.7 | 40.1 | ||||
| Orange | 3.6 | 3.8 | 3.6 | 49.0 | 48.2 | 48.5 | ||||
| Riverside | 4.1 | 4.6 | 4.3 | 50.7 | 53.3 | 55.0 | ||||
| San Bernardino | 4.2 | 4.0 | 4.4 | 38.2 | 45.7 | 43.0 | ||||
| San Diego | 3.1 | 3.2 | 3.3 | 22.1 | 21.8 | 23.2 | ||||
| Ventura | 3.8 | 4.1 | r | 4.0 | 51.4 | 53.0 | 51.7 | |||
| Central Coast | ||||||||||
| Monterey | 3.9 | 3.9 | 3.9 | 24.8 | 28.5 | 26.2 | ||||
| San Luis Obispo | 4.4 | 4.3 | 5.2 | 25.9 | 29.3 | 27.5 | ||||
| Santa Barbara | 4.4 | 4.6 | 3.4 | 28.8 | 28.8 | 27.2 | r | |||
| Santa Cruz | 3.0 | 2.7 | 3.0 | 22.4 | 20.9 | 21.7 | ||||
| Central Valley | ||||||||||
| Fresno | 3.8 | 3.8 | 4.3 | 25.8 | 27.1 | 25.6 | ||||
| Glenn | 6.8 | 4.1 | 3.8 | 20.9 | 31.0 | 25.2 | ||||
| Kern | 3.7 | 3.9 | 3.6 | r | 26.4 | 26.3 | 26.4 | r | ||
| Kings | 2.9 | 3.2 | 4.5 | 25.5 | 23.4 | 27.9 | ||||
| Madera | 5.3 | 4.7 | 7.9 | 57.1 | 92.5 | 42.9 | ||||
| Merced | 3.5 | 4.2 | 4.0 | 39.0 | 31.8 | 38.3 | ||||
| Placer | 3.0 | 3.0 | 3.1 | 21.1 | 21.1 | 22.3 | ||||
| Sacramento | 2.5 | 2.4 | 2.9 | 18.9 | 19.7 | 20.6 | ||||
| San Benito | 3.8 | 3.3 | 2.6 | 19.9 | 24.7 | 19.8 | ||||
| San Joaquin | 2.6 | 2.9 | 2.8 | 20.9 | 22.6 | 23.9 | ||||
| Stanislaus | 2.9 | 2.8 | 2.9 | 22.0 | 22.4 | 23.9 | ||||
| Tulare | 3.6 | 4.5 | 4.3 | 28.6 | 28.7 | 25.9 | ||||
| Other Counties in California | ||||||||||
| Amador | 5.8 | 5.1 | 5.4 | 28.7 | 41.2 | 28.8 | ||||
| Butte | 2.6 | 3.6 | r | 3.5 | r | 24.1 | 23.3 | 24.6 | ||
| Calaveras | 5.8 | 6.2 | 7.2 | 33.8 | 48.4 | 50.3 | ||||
| Del Norte | 6.9 | 10.3 | 8.3 | 91.0 | 105.5 | 105.5 | ||||
| El Dorado | 4.1 | 4.3 | 4.5 | 29.0 | 29.2 | 27.2 | ||||
| Humboldt | 4.2 | 3.8 | 5.0 | 25.2 | 26.6 | 27.5 | ||||
| Lake | 7.2 | 6.6 | 6.8 | 75.5 | 58.2 | 66.6 | ||||
| Mariposa | 6.1 | 8.5 | 6.0 | 86.4 | 75.5 | 82.8 | ||||
| Mendocino | 6.8 | 9.5 | r | 7.4 | r | 50.8 | 75.5 | r | 72.3 | r |
| Nevada | 4.8 | 5.6 | 4.8 | 29.5 | 25.8 | 33.8 | ||||
| Plumas | 17.7 | 37.3 | 14.4 | r | 71.9 | 85.2 | 116.4 | r | ||
| Shasta | 4.7 | 4.5 | 5.5 | 36.4 | 37.1 | 29.3 | ||||
| Siskiyou | 7.1 | 6.6 | 10.8 | 48.7 | 115.9 | 86.4 | ||||
| Sutter | 2.8 | 2.4 | 3.5 | 27.0 | 29.7 | 32.0 | ||||
| Tehama | 5.6 | 6.7 | 5.4 | 58.6 | 75.5 | 48.1 | r | |||
| Tuolumne | 7.0 | 6.8 | 7.2 | 25.7 | 25.9 | 36.8 | ||||
| Yolo | 2.5 | 3.0 | 2.4 | 19.0 | 20.9 | 19.8 | ||||
| Yuba | 2.5 | 2.7 | 3.5 | 22.4 | 23.5 | 21.7 | ||||
r = revised
Source: C.A.R.