
California pending home sales contract in November
December 29, 2016 - LOS ANGELES – Pending home sales dropped from both the previous month and last year in November, indicating that the robust sales registered in November will likely not be repeated in the months ahead, the CALIFORNIA ASSOCIATION OF REALTORS® (C.A.R.) said on November 22.
California’s housing market showed signs of slowing competition with more properties selling below asking price and fewer properties receiving more than three offers compared to a year ago, as reflected in C.A.R.’s November Market Pulse Survey**.
Pending home sales data:
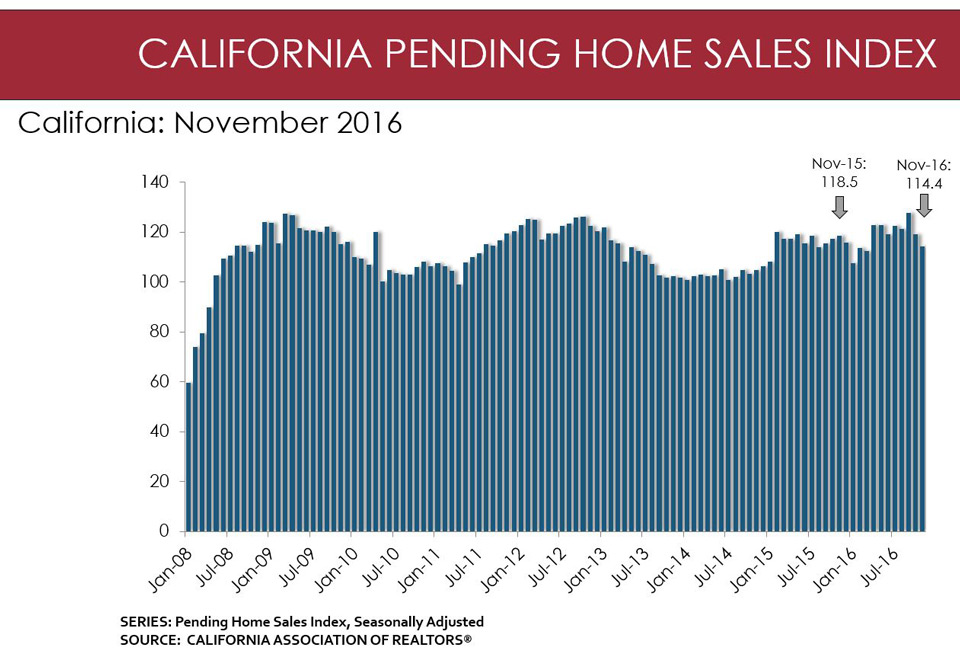
• Based on signed contracts, statewide pending home sales fell in November on a seasonally adjusted basis, with the Pending Home Sales Index (PHSI)* falling 3.5 percent from 118.5 in November 2015 to 114.4 in November 2016 – the first year-to-year decrease in eight months. On a monthly basis, California pending home sales were down 4 percent from the October index of 119.1.
• At the regional level, for Southern California as a whole, pending sales dropped 11.9 percent on a monthly basis and were up 3.9 percent on an annual basis. Los Angeles, Orange, and San Bernardino counties posted healthy year-over-year increases of 7.5 percent, 5.3 percent, and 5 percent, respectively.
• For the San Francisco Bay Area as a whole, pending sales were 18.1 percent lower than October and 12.3 percent lower than November 2015, as high housing prices continued to erode affordability. San Francisco, San Mateo, and Santa Clara counties all experienced annual declines in pending home sales of 1.1 percent, 8.7 percent, and 14.9 percent, respectively.
• Overall pending sales in the Central Valley declined from both the previous month and year, decreasing 4.7 percent from October and 4.6 percent from a year ago.
Year-to-Year Change in Pending Sales by County/Region
| County/Region/State | Nov-16 | Nov-15 | Yearly % Change |
| Counties | |||
| Kern | 56.4 | 60.5 | -6.8% |
| Los Angeles | 74.7 | 69.5 | 7.5% |
| Monterey | 57.1 | 55.3 | 3.2% |
| Orange | 58.3 | 55.3 | 5.3% |
| Sacramento | 60.7 | 63.9 | -5.0% |
| San Bernardino | 63.1 | 60.1 | 5.0% |
| San Diego | 107.5 | 113.6 | -5.4% |
| San Francisco | 95.7 | 96.7 | -1.1% |
| San Mateo | 89.4 | 97.8 | -8.7% |
| Santa Clara | 70.6 | 83.0 | -14.9% |
| Regions | |||
| SF Bay Area | 118.8 | 135.4 | -12.3% |
| So. CA | 89.1 | 85.7 | 3.9% |
| Central Valley | 80.3 | 84.2 | -4.6% |
| California (SA) | 114.4 | 118.5 | -3.5% |
November REALTOR® Market Pulse Survey**:
In a reflection of a typical seasonal slowdown, California REALTORS® responding to C.A.R.’s November Market Pulse Survey reported a decline in floor calls, listing appointments, and open house traffic. Additionally, three times the number of REALTORS® were concerned with rising interest rates compared to October.
• The share of homes selling below asking price rose from 40 percent a year ago to 44 percent in November. Conversely, the share of properties selling above asking price dipped to 25 percent from 27 percent in November 2015. The remaining 31 percent sold at asking price, down from 33 percent in November 2015.
• For homes that sold above asking price, the premium paid over asking price dropped to 8.4 percent, down from 9.1 percent in October and 8.9 percent a year ago.
• The 44 percent of homes that sold below asking price sold for an average of 11 percent below asking price in November, up from 8.9 percent in October and down 13 percent from a year ago.
• Two-thirds of properties for sale (66 percent) received multiple offers in November, up from 59 percent in October and unchanged from November 2015.
• The share of properties receiving three or more offers increased to 36 percent. Thirty percent of properties received three or more offers in October, and 38 percent of properties received three or more offers a year ago.
• Compared to a year ago, there was an increase in the share of homes receiving three or more offers in homes priced below $200,000, $400,000 to $499,000, and $2 million and higher. The share of homes priced $200,000 to $299,000 experienced the sharpest decline, falling from 42 percent in November 2015 to 18 percent in November 2016.
• About a third (31 percent) of properties had listing price reductions in November, unchanged from October and up slightly from 30 percent in November 2015.
• Rising interest rates moved near the top of REALTORS®’ concerns in November, with triple the number of REALTORS® who were concerned about higher rates than in October. Rising interest rates concerned 19 percent of REALTORS®, up from 6 percent in October. High home prices and housing affordability concerned 39 percent of REALTORS®, while a lack of available homes for sale concerned 26 percent. REALTORS® also were concerned about a slowdown in economic growth, lending and financing, and policy and regulations.
• REALTORS®’ expectation of market conditions over the next year has been trending downward for the past few months but is still in positive territory at an index of 54 in November, unchanged from October but down from 57 in November 2015.
Graphics (click links to open):
• YTY change in pending home sales by region.
• More properties selling below asking price.
• Average number of multiple offers received.
• Price range of homes receiving 3+ offers.
• Lack of inventory, rising interest rates top REALTORS®’ concerns.
Follow us on Twitter @CAR Media and @CAREALTORS®
Like us on Facebook, and check us out on Instagram.
*Note: C.A.R.’s pending sales information is generated from a survey of more than 70 associations of REALTORS® and MLSs throughout the state. Pending home sales are forward-looking indicators of future home sales activity, offering solid information on future changes in the direction of the market. A sale is listed as pending after a seller has accepted a sales contract on a property. The majority of pending home sales usually become closed sales transactions one to two months later. The year 2008 was used as the benchmark for the Pending Homes Sales Index. An index of 100 is equal to the average level of contract activity during 2008.
**C.A.R.’s Market Pulse Survey is a monthly online survey sent to more than 10,000 California REALTORS® to measure data about their last closed transaction and sentiment about business activity in their market area for the previous month. Approximately 300 REALTORS® responded.
Leading the way...® in California real estate for more than 110 years, the CALIFORNIA ASSOCIATION OF REALTORS® (www.car.org) is one of the largest state trade organizations in the United States with 185,000 members dedicated to the advancement of professionalism in real estate. C.A.R. is headquartered in Los Angeles.
Source: C.A.R.