
Led by Southern California, state’s pending home sales trend higher in December
February 7, 2017 - LOS ANGELES – Led by the Southern California region, California pending home sales registered gains on a month-to-month and year-to-year basis, portending a moderate increase in sales in the near term, the CALIFORNIA ASSOCIATION OF REALTORS® (C.A.R.) said on January 24, 2017.
The modest sales growth is unlikely to be sustained, however, given the severe shortage of homes for sale and affordability concerns, as indicated in C.A.R.’s December Market Pulse Survey**, which saw fewer listing appointments and less open house traffic.
Pending home sales data:
• Based on signed contracts, statewide pending home sales increased in December on a seasonally adjusted basis, with the Pending Home Sales Index (PHSI)* rising 1.9 percent from 115.8 from December 2015 to 118.1 in December 2016 – even with new mortgage rules that pushed sales higher December a year ago. On a monthly basis, California pending home sales were up 3.3 percent from the November index of 114.4.
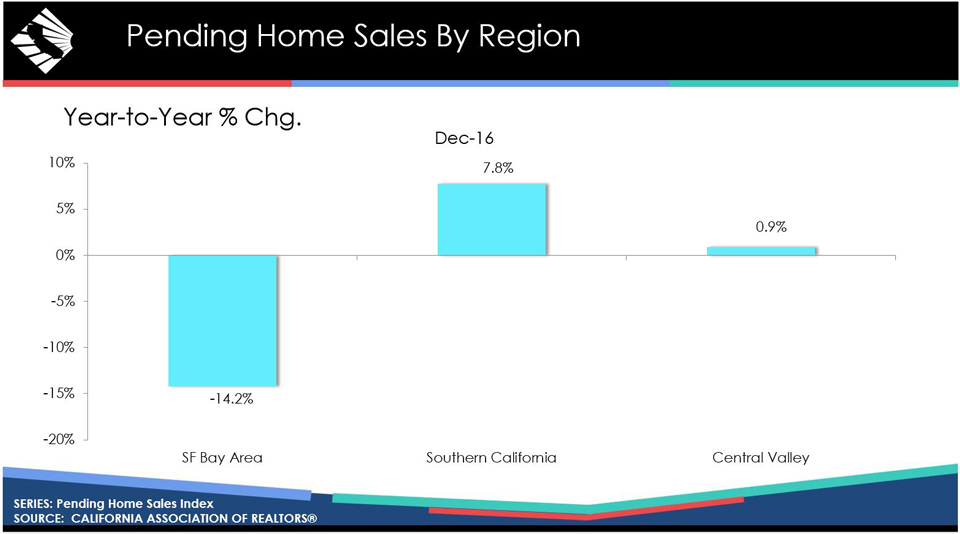
• Southern California saw the largest increase in pending sales last month, rising 7.8 percent on an annual basis and decreasing 16.1 percent on a monthly basis. Thanks to the highest level of available homes for sale and greatest affordability, San Bernardino led the region in pending sales, posting a 9.5 percent increase from a year ago. Los Angeles and San Diego counties also posted modest year-over-year increases of 5.2 percent and 7.9 percent, respectively. Orange County was the only area within Southern California that saw pending sales lower on an annual basis by 11.5 percent.
• On the flip side, in the San Francisco Bay Area as a whole, tight housing supplies and low affordability contributed to a fall in pending sales of 14.2 percent compared to December 2015 and 32.5 percent from November. San Mateo County led the region’s decline at 35.3 percent, followed by San Francisco County at 23.3 percent, and Santa Clara County at 18.6 percent. The significant year-over-year sales decline in the Bay Area can be attributed to the prevalence of higher-priced properties in the region that were affected by new mortgage lending rules implemented in fall 2015.
• Overall pending sales in the Central Valley improved 0.9 percent from December 2015 and were down 18.4 percent from November. Within Central Valley, pending sales were up 5.2 percent in Kern County and 7.6 percent in Sacramento compared with a year ago.
Year-to-Year Change in Pending Sales by County/Region
| County/Region/State | Dec-16 | Dec-15 | Yearly % Change |
| Counties | |||
| Kern | 55.4 | 52.7 | 5.2% |
| Los Angeles | 55.3 | 52.6 | 5.2% |
| Orange | 40.4 | 45.7 | -11.5% |
| San Diego | 89.3 | 82.8 | 7.9% |
| San Bernardino | 50.0 | 45.7 | 9.5% |
| Monterey | 42.7 | 46.5 | -8.2% |
| Sacramento | 47.6 | 44.3 | 7.6% |
| San Francisco | 34.3 | 44.7 | -23.3% |
| San Mateo | 40.6 | 62.8 | -35.3% |
| Santa Clara | 42.9 | 52.7 | -18.6% |
| Regions | |||
| SF Bay Area | 80.2 | 93.5 | -14.2% |
| So. CA | 74.8 | 69.4 | 7.8% |
| Central Valley | 65.6 | 65.0 | 0.9% |
| California (SA) | 118.1 | 115.8 | 1.9% |
Reflecting the typical seasonal slowdown, California REALTORS® responding to C.A.R.’s December Market Pulse Survey reported a decline in floor calls, listing appointments, and open house traffic.
• The share of homes selling below asking price fell from 57 percent a year ago to 43 percent in December. Conversely, the share of properties selling above asking price increased to 23 percent from 18 percent in December 2015. The remaining 34 percent sold at asking price, up from 25 percent in December 2015.
• For homes that sold above asking price, the premium paid over asking price rose to 11 percent, up from 8.4 percent in November and 9.2 percent a year ago.
• The 43 percent of homes that sold below asking price sold for an average of 22 percent below asking price in December, double the November figure of 11 percent, and was up from 13 percent from a year ago.
• Nearly two-thirds of properties for sale (64 percent) received multiple offers in December, down from 66 percent in November and 65 percent in December 2015.
• The share of properties receiving three or more offers in December increased to 40 percent. Thirty-six percent of properties received three or more offers in November, and 40 percent of properties received three or more offers a year ago.
• Compared to a year ago, homes priced $400,000 to $499,000 and $2 million and higher experienced the greatest drop in three or more offers, while only homes priced $500,000 to $749,000 and $750,000 to $999,000 experienced an increase in three or more offers.
• More than one-fourth (26 percent) of properties had listing price reductions in December, down from 31 percent in November and 30 percent in December 2015.
• High home prices and housing affordability were the top concern for 38 percent of REALTORS®. Climbing for four straight months, a lack of available inventory concerned 29 percent of REALTORS®, followed by inflated home prices/housing bubble cited by 18 percent of REALTORS®. A slowdown in economic growth, lending and financing, and policy and regulations rounded out REALTORS®’ remaining biggest concerns.
• REALTORS®’ expectation of market conditions over the next year climbed for the fifth straight month to an index of 65 in December, up from 58 in November but unchanged from December 2015.
Graphics (click links to open):
• YTY change in pending home sales by region.
• Fewer properties selling below asking price.
• Share of properties receiving multiple offers.
• Price range of homes receiving 3+ offers.
• Lack of inventory, low housing affordability top REALTORS®’ concerns.
*Note: C.A.R.’s pending sales information is generated from a survey of more than 70 associations of REALTORS® and MLSs throughout the state. Pending home sales are forward-looking indicators of future home sales activity, offering solid information on future changes in the direction of the market. A sale is listed as pending after a seller has accepted a sales contract on a property. The majority of pending home sales usually become closed sales transactions one to two months later. The year 2008 was used as the benchmark for the Pending Homes Sales Index. An index of 100 is equal to the average level of contract activity during 2008.
**C.A.R.’s Market Pulse Survey is a monthly online survey sent to more than 10,000 California REALTORS® to measure data about their last closed transaction and sentiment about business activity in their market area for the previous month. Approximately 300 REALTORS® responded.
Leading the way...® in California real estate for more than 110 years, the CALIFORNIA ASSOCIATION OF REALTORS® (www.car.org) is one of the largest state trade organizations in the United States with more than 185,000 members dedicated to the advancement of professionalism in real estate. C.A.R. is headquartered in Los Angeles.
Source: C.A.R.