
- Existing, single-family home sales totaled 420,100 in January on a seasonally adjusted annualized rate, up 2.1 percent from December and 4.4 percent from January 2016.
- January’s statewide median home price was $489,580, down 3.8 percent from December and up 4.8 percent from January 2016.
- Statewide sales of condos fell 22.1 percent from December on a non-seasonally adjusted basis and rose 7.5 percent from January a year ago.
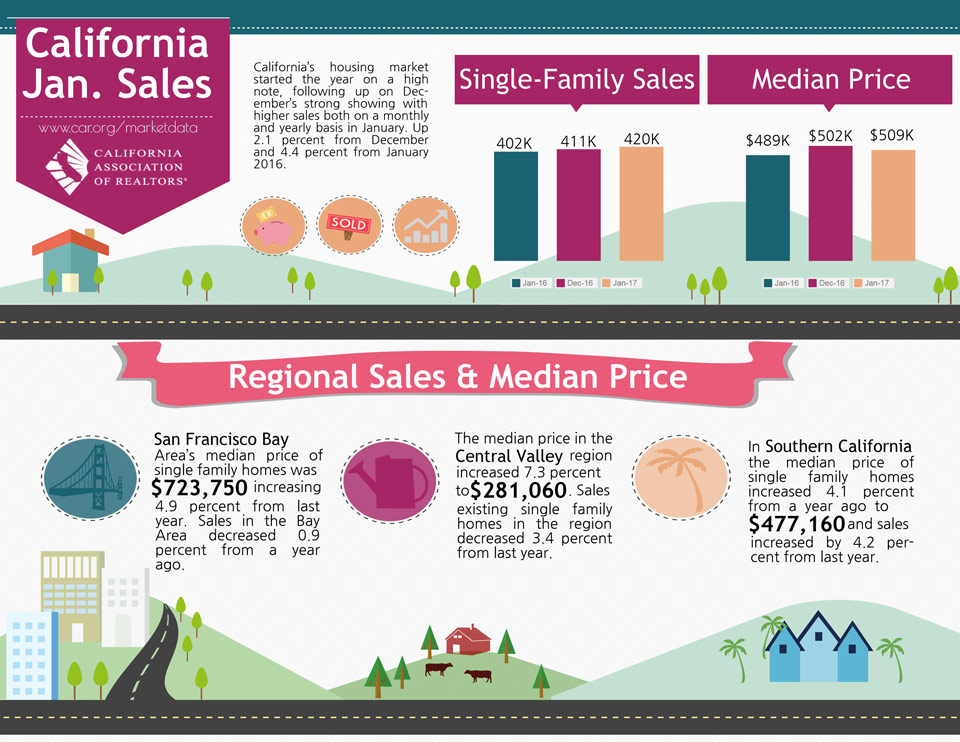
February 21, 2017 - LOS ANGELES – California’s housing market started the year on a high note, following up on December’s strong showing with higher sales both on a monthly and yearly basis in January, the CALIFORNIA ASSOCIATION OF REALTORS® (C.A.R.) said last week.
Closed escrow sales of existing, single-family detached homes in California totaled a seasonally adjusted annualized rate of 420,100 units in January, according to information collected by C.A.R. from more than 90 local REALTOR® associations and MLSs statewide. The statewide sales figure represents what would be the total number of homes sold during 2017 if sales maintained the January pace throughout the year. It is adjusted to account for seasonal factors that typically influence home sales.
The January figure was up 2.1 percent from the 411,430 level in December, and up 4.4 percent compared with home sales in January 2016 of a revised 402,220. The month-to-month gain was the first December-to-January increase since 2012, which is an encouraging sign.
“California’s housing market continues to be defined by the higher-priced, coastal markets and the less expensive, inland areas that still offer access to major employment centers,” said C.A.R. President Geoff McIntosh. “For example, eroding affordability and tight housing inventory are pushing buyers away from the core Bay Area markets of San Francisco, San Mateo, and Santa Clara and into less expensive bedroom communities, such as Contra Costa, Napa, and Solano. In Southern California, an influx of buyers from coastal employment areas into the Inland Empire drove healthy year-over-year sales in Riverside and San Bernardino.”
The median price of an existing, single-family detached California home fell below the $500,000 mark for the first time since March 2016, but home prices remain seasonably strong. The median price was down 3.8 percent from a revised $508,870 in December to $489,580 in January. The median sales price is the point at which half of homes sold for more and half sold for less; it is influenced by the types of homes selling, as well as a general change in values.
January’s median price was up 4.8 percent from the revised $467,160 recorded in January 2016, a slightly slower pace than the 5.6 percent increase averaged last year. Since 2011, price declines from December to January have usually ranged from -11.7 percent to as little as -4.6 percent, but January’s 3.8 percent monthly smaller price decline suggests that price pressure remains relatively robust and could translate into additional price growth as the spring and summer home-buying seasons near.
“January’s sales increase was likely boosted by rising interest rates, which have risen sharply since the election and have given buyers an incentive to get off the sidelines and close escrow before rates go higher,” said C.A.R. Senior Vice President and Chief Economist Leslie Appleton-Young. “Yet, future anticipated rate hikes will increase the cost of homebuying and could have an adverse effect on affordability and future home sales.”
Other key points from C.A.R.’s January 2017 resale housing report include:
• C.A.R.’s Unsold Inventory Index, which measures the number of months needed to sell the supply of homes on the market at the current sales rate, rose to 3.7 months in January from 2.6 months in December. The index stood at 4.3 months in January 2016.
• New listings in pricey Bay Area counties, such as Marin, San Francisco, San Mateo, and Santa Clara rose significantly from December, a possible indication of sellers cashing out robust price appreciation experienced over the past few years.
• New statewide active listings continued to decline, dipping 0.3 percent from December and 10.5 percent from January 2016.
• The median number of days it took to sell a single-family home went up from 33 days in December to 37 days in January but was down from 44.2 days in January 2016.
• C.A.R.’s sales-to-list price ratio* was 98.1 of listing prices statewide in January, 98.2 percent in December and 97.8 in January 2016.
• The average price per square foot** for an existing, single-family home statewide was $240 in January, $242 in December, and $228 in January 2016.
• San Francisco County had the highest price per square foot in January at $841/sq. ft., followed by San Mateo ($723/sq. ft.), and Santa Clara ($567/sq. ft.). Counties with the lowest price per square foot in January included Del Norte ($124/sq. ft.), Kings ($125/sq. ft.), and Kern ($127/sq. ft.).
• After mortgage rates surged in the final few weeks of 2016, the 30-year, fixed-mortgage interest rate averaged 4.15 percent in January, down from 4.2 percent in December but was up from 3.87 percent in January 2016, according to Freddie Mac. The five-year, adjustable-rate mortgage interest rates edged up in January to an average of 3.24 percent, from 3.23 percent in December and 2.98 percent in January 2016.
Graphics (click links to open):
• January sales at-a-glance infographic.
• Calif. historical existing home sales.
• Calif. historical median home price.
• Share of sales by price range.
• Calif. price per square foot.
• Calif. sales to list price ratio.
Note: The County MLS median price and sales data in the tables are generated from a survey of more than 90 associations of REALTORS® throughout the state, and represent statistics of existing single-family detached homes only. County sales data are not adjusted to account for seasonal factors that can influence home sales. Movements in sales prices should not be interpreted as changes in the cost of a standard home. The median price is where half sold for more and half sold for less; medians are more typical than average prices, which are skewed by a relatively small share of transactions at either the lower-end or the upper-end. Median prices can be influenced by changes in cost, as well as changes in the characteristics and the size of homes sold. The change in median prices should not be construed as actual price changes in specific homes.
*Sales-to-list price ratio is an indicator that reflects the negotiation power of home buyers and home sellers under current market conditions. The ratio is calculated by dividing the final sales price of a property by its last list price and is expressed as a percentage. A sales-to-list ratio with 100 percent or above suggests that the property sold for more than the list price, and a ratio below 100 percent indicates that the price sold below the asking price.
**Price per square foot is a measure commonly used by real estate agents and brokers to determine how much a square foot of space a buyer will pay for a property. It is calculated as the sale price of the home divided by the number of finished square feet. C.A.R. currently tracks price-per-square foot statistics for 39 counties.
Leading the way…® in California real estate for more than 110 years, the CALIFORNIA ASSOCIATION OF REALTORS® (www.car.org) is one of the largest state trade organizations in the United States with 185,000 members dedicated to the advancement of professionalism in real estate. C.A.R. is headquartered in Los Angeles.
January 2016 County Sales and Price Activity
(Regional and condo sales data not seasonally adjusted)
| January-17 | Median Sold Price of Existing Single-Family Homes | Sales | |||||||
| State/Region/County | Jan-17 | Dec-16 | Jan-16 | MTM% Chg | YTY% Chg | MTM% Chg | YTY% Chg | ||
| CA SFH (SAAR) | $489,580 | $508,870 | $467,160 | r | -3.8% | 4.8% | 2.1% | 4.4% | |
| CA Condo/Townhomes | $399,710 | $403,240 | $380,110 | r | -0.9% | 5.2% | -22.1% | 7.5% | |
| Los Angeles Metro Area | $450,710 | $463,380 | $434,000 | r | -2.7% | 3.9% | -31.2% | -5.6% | |
| Inland Empire | $312,500 | $320,970 | $291,920 | -2.6% | 7.0% | -18.4% | 8.6% | ||
| S.F. Bay Area | $723,750 | $770,000 | r | $690,000 | r | -6.0% | 4.9% | -30.7% | -0.9% |
| S.F. Bay Area | |||||||||
| Alameda | $755,000 | $755,000 | $700,000 | r | 0.0% | 7.9% | -32.9% | -0.4% | |
| Contra Costa | $540,000 | $550,000 | $500,000 | r | -1.8% | 8.0% | -26.0% | 10.4% | |
| Marin | $1,150,000 | $1,118,700 | $952,500 | r | 2.8% | 20.7% | -37.2% | -3.6% | |
| Napa | $662,500 | $605,000 | $584,500 | r | 9.5% | 13.3% | -18.3% | 0.0% | |
| San Francisco | $1,250,000 | $1,315,210 | $1,160,000 | r | -5.0% | 7.8% | -45.7% | 1.0% | |
| San Mateo | $1,150,000 | $1,332,500 | $1,077,500 | -13.7% | 6.7% | -38.9% | -11.6% | ||
| Santa Clara | $927,500 | $965,000 | $895,000 | -3.9% | 3.6% | -33.9% | -7.8% | ||
| Solano | $387,400 | $405,000 | $354,000 | r | -4.3% | 9.4% | -22.3% | 6.8% | |
| Sonoma | $579,500 | $585,000 | $550,000 | r | -0.9% | 5.4% | -23.3% | -11.3% | |
| Southern California | |||||||||
| Los Angeles | $509,320 | $519,280 | r | $480,950 | -1.9% | 5.9% | -26.3% | 6.7% | |
| Orange | $740,000 | $745,000 | $699,900 | r | -0.7% | 5.7% | -26.8% | -1.1% | |
| Riverside | $357,500 | $360,000 | $328,000 | r | -0.7% | 9.0% | -20.6% | 9.9% | |
| San Bernardino | $242,650 | $253,460 | $234,460 | -4.3% | 3.5% | -14.6% | 6.7% | ||
| San Diego | $550,000 | $568,000 | $530,000 | r | -3.2% | 3.8% | -25.3% | 6.8% | |
| Ventura | $606,150 | $627,580 | $638,590 | -3.4% | -5.1% | -29.7% | -17.3% | ||
| Central Coast | |||||||||
| Monterey | $572,500 | $497,000 | $500,000 | 15.2% | 14.5% | -24.9% | 2.5% | ||
| San Luis Obispo | $536,000 | $559,000 | $540,000 | r | -4.1% | -0.7% | -14.2% | 13.4% | |
| Santa Barbara | $710,000 | $735,000 | $748,000 | r | -3.4% | -5.1% | -22.3% | 1.4% | |
| Santa Cruz | $800,000 | $805,000 | $694,500 | -0.6% | 15.2% | -7.9% | 20.8% | ||
| Central Valley | |||||||||
| Fresno | $235,000 | $238,220 | $216,000 | r | -1.4% | 8.8% | -29.4% | 3.8% | |
| Glenn | $221,000 | $197,500 | $159,975 | r | 11.9% | 38.1% | 6.7% | -11.1% | |
| Kern | $215,000 | $220,000 | $215,000 | -2.3% | 0.0% | -12.5% | -7.7% | ||
| Kings | $200,000 | $215,000 | $190,000 | r | -7.0% | 5.3% | -14.1% | 65.9% | |
| Madera | $229,900 | $227,950 | $227,500 | r | 0.9% | 1.1% | -33.8% | -2.2% | |
| Merced | $225,500 | $235,000 | $193,950 | r | -4.0% | 16.3% | -11.6% | 2.4% | |
| Placer | $425,000 | $425,000 | $405,000 | r | 0.0% | 4.9% | -40.0% | -10.2% | |
| Sacramento | $305,000 | $314,940 | $281,000 | r | -3.2% | 8.5% | -27.2% | 14.1% | |
| San Benito | $550,000 | $475,000 | $480,000 | 15.8% | 14.6% | -21.1% | -37.5% | ||
| San Joaquin | $307,500 | $326,750 | $290,000 | r | -5.9% | 6.0% | -32.3% | -16.1% | |
| Stanislaus | $279,750 | $275,000 | $245,000 | r | 1.7% | 14.2% | -27.0% | 4.0% | |
| Tulare | $202,500 | $204,950 | $195,000 | r | -1.2% | 3.8% | -29.8% | 28.0% | |
| Other Calif. Counties | |||||||||
| Amador | $295,000 | $272,500 | $215,500 | r | 8.3% | 36.9% | -22.7% | 13.3% | |
| Butte | $264,000 | $294,250 | $260,000 | r | -10.3% | 1.5% | -69.4% | -56.3% | |
| Calaveras | $285,000 | $288,000 | $258,750 | r | -1.0% | 10.1% | -29.0% | 42.0% | |
| Del Norte | $218,500 | $232,250 | $157,000 | r | -5.9% | 39.2% | -12.5% | -26.3% | |
| El Dorado | $414,250 | $434,500 | $405,000 | r | -4.7% | 2.3% | -36.0% | -2.8% | |
| Humboldt | $296,500 | $295,000 | $247,800 | r | 0.5% | 19.7% | -21.0% | 16.9% | |
| Lake | $215,000 | $210,000 | $235,000 | r | 2.4% | -8.5% | -24.4% | 15.7% | |
| Mariposa | $272,450 | $227,000 | $279,000 | r | 20.0% | -2.3% | -30.0% | -6.7% | |
| Mendocino | $417,500 | $366,000 | $355,000 | r | 14.1% | 17.6% | -17.0% | 25.8% | |
| Mono | $526,750 | $528,500 | $475,000 | -0.3% | 10.9% | -42.9% | -27.3% | ||
| Nevada | $366,500 | $355,000 | $339,500 | r | 3.2% | 8.0% | 11.1% | 45.2% | |
| Plumas | $300,250 | $230,000 | $342,000 | r | 30.5% | -12.2% | -26.7% | 15.8% | |
| Shasta | $233,375 | $235,750 | $226,250 | r | -1.0% | 3.1% | -34.4% | 22.9% | |
| Siskiyou | $239,000 | $255,000 | $195,000 | r | -6.3% | 22.6% | -12.9% | -12.9% | |
| Sutter | $251,995 | $253,500 | $213,700 | r | -0.6% | 17.9% | -30.6% | -3.8% | |
| Tehama | $210,000 | $204,250 | $190,000 | r | 2.8% | 10.5% | -20.6% | 42.1% | |
| Tuolumne | $279,450 | $253,375 | $210,000 | r | 10.3% | 33.1% | -28.6% | -12.3% | |
| Yolo | $380,000 | $405,000 | $345,000 | r | -6.2% | 10.1% | -18.7% | 18.9% | |
| Yuba | $250,000 | $247,450 | $210,000 | r | 1.0% | 19.0% | -16.2% | -9.5% | |
January 2016 County Unsold Inventory and Time on Market
(Regional and condo sales data not seasonally adjusted)
| January-17 | Unsold Inventory Index | Median Time on Market | ||||||||
| State/Region/County | Jan-17 | Dec-16 | Jan-16 | Jan-17 | Dec-16 | Jan-16 | ||||
| CA SFH (SAAR) | 3.7 | 2.6 | 4.3 | 37.3 | 33.0 | 44.2 | r | |||
| CA Condo/Townhomes | 3.2 | 2.2 | 3.8 | 32.0 | 29.6 | 40.7 | ||||
| Los Angeles Metro Area | 4.1 | 3.0 | 5.5 | r | 46.6 | 42.9 | 57.3 | |||
| Inland Empire | 4.6 | 3.6 | 5.0 | r | 49.8 | 46.7 | 61.9 | |||
| S.F. Bay Area | 2.5 | 1.5 | 1.9 | r | 23.8 | 26.7 | 28.1 | |||
| S.F. Bay Area | ||||||||||
| Alameda | 2.0 | 1.2 | 2.0 | 24.1 | 21.9 | 22.5 | ||||
| Contra Costa | 2.2 | 1.6 | 2.5 | 24.6 | 23.9 | 24.3 | ||||
| Marin | 3.7 | 1.9 | 2.8 | 47.7 | 46.2 | 45.5 | ||||
| Napa | 4.5 | 3.6 | 4.1 | 79.6 | 51.3 | 65.1 | ||||
| San Francisco | 2.2 | 0.9 | 2.3 | 37.7 | 31.0 | 33.9 | ||||
| San Mateo | 2.3 | 1.1 | 1.9 | 24.3 | 21.7 | 22.1 | ||||
| Santa Clara | 2.2 | 1.2 | 1.9 | 23.7 | 23.3 | 23.6 | ||||
| Solano | 2.9 | 2.1 | 3.4 | 58.3 | 48.6 | 50.0 | ||||
| Sonoma | 3.4 | 2.5 | 3.2 | 56.3 | 50.1 | 65.6 | ||||
| Southern California | ||||||||||
| Los Angeles | 3.6 | 2.6 | 4.3 | 40.8 | 35.1 | 51.2 | ||||
| Orange | 4.0 | 2.6 | 4.1 | 50.3 | 47.2 | 64.2 | ||||
| Riverside | 5.1 | 3.8 | 6.3 | 52.1 | 47.2 | 64.5 | ||||
| San Bernardino | 3.8 | 3.2 | 4.8 | 46.1 | 45.7 | 57.0 | ||||
| San Diego | 3.6 | 2.6 | 4.3 | 27.4 | 26.6 | 27.0 | ||||
| Ventura | 4.4 | 3.3 | 4.8 | 61.2 | 65.9 | 72.2 | ||||
| Central Coast | ||||||||||
| Monterey | 4.9 | 3.5 | 4.7 | 39.9 | 32.2 | 51.5 | ||||
| San Luis Obispo | 4.1 | 3.4 | 5.1 | 40.3 | 36.6 | 43.4 | ||||
| Santa Barbara | 5.6 | 4.0 | 4.9 | 52.4 | 32.5 | 51.4 | ||||
| Santa Cruz | 2.5 | 2.4 | 2.8 | 32.2 | 31.0 | 38.6 | ||||
| Central Valley | ||||||||||
| Fresno | 4.4 | 3.0 | 5.1 | 27.5 | 27.4 | 32.0 | ||||
| Glenn | 4.5 | 4.9 | 3.1 | 91.0 | 52.8 | 24.7 | ||||
| Kern | 4.3 | 3.6 | 4.8 | 32.6 | 29.7 | 41.0 | ||||
| Kings | 3.2 | 2.8 | 6.1 | 28.1 | 25.2 | 31.0 | ||||
| Madera | 5.8 | 4.1 | 7.8 | 49.1 | 54.2 | 78.4 | ||||
| Merced | 3.8 | 3.1 | 4.7 | 39.1 | 29.1 | 55.5 | ||||
| Placer | 3.3 | 1.8 | 3.5 | 26.5 | 27.0 | 27.5 | ||||
| Sacramento | 2.2 | 1.6 | 3.0 | 24.4 | 24.0 | 26.6 | ||||
| San Benito | 4.8 | 3.7 | 2.4 | 42.6 | 31.0 | 35.5 | ||||
| San Joaquin | 3.2 | 2.2 | 3.1 | 27.9 | 26.5 | 28.9 | ||||
| Stanislaus | 3.4 | 2.4 | 3.7 | 28.2 | 26.8 | 31.5 | ||||
| Tulare | 5.2 | 3.2 | 6.4 | 31.8 | 28.1 | 43.3 | ||||
| Other Counties in California | ||||||||||
| Amador | 4.9 | 3.9 | 6.3 | 82.8 | 75.5 | 91.0 | ||||
| Butte | 4.0 | 2.4 | 3.9 | 42.7 | 26.2 | 55.7 | ||||
| Calaveras | 5.5 | 4.3 | 8.1 | 84.6 | 46.4 | 86.8 | ||||
| Del Norte | 8.2 | 7.1 | 6.7 | 124.6 | 110.3 | 122.5 | ||||
| El Dorado | 3.0 | 2.6 | 4.7 | 53.1 | 54.4 | 53.8 | ||||
| Humboldt | 4.0 | 2.8 | 4.9 | 38.3 | 29.2 | 41.2 | ||||
| Lake | 5.5 | 3.9 | 6.8 | 55.7 | 91.0 | 82.3 | ||||
| Mariposa | 3.8 | 3.1 | 6.1 | 48.4 | 100.7 | 98.3 | ||||
| Mendocino | 6.4 | 5.5 | 10.2 | 123.1 | 73.7 | 112.8 | ||||
| Mono | 11.3 | 6.8 | NA | 130.7 | 129.7 | 134.1 | ||||
| Nevada | 3.6 | 4.1 | 6.0 | 45.5 | 26.0 | 61.0 | ||||
| Plumas | 8.2 | 6.7 | 10.0 | 132.3 | 128.3 | 132.8 | ||||
| Shasta | 5.0 | 3.4 | 7.7 | 41.2 | 28.7 | 51.9 | ||||
| Siskiyou | 7.3 | 6.8 | 7.3 | 82.8 | 49.1 | 78.4 | ||||
| Sutter | 3.3 | 2.1 | 4.1 | 27.9 | 29.2 | 27.9 | ||||
| Tehama | 6.4 | 5.4 | 9.0 | 75.5 | 80.3 | 82.8 | ||||
| Tuolumne | 5.5 | 4.3 | 5.1 | 65.1 | 52.8 | 98.3 | ||||
| Yolo | 2.6 | 1.8 | 3.0 | 31.6 | 22.4 | 31.5 | ||||
| Yuba | 3.1 | 2.8 | 3.2 | 32.0 | 23.9 | 29.5 | ||||
NA = not available
Source: C.A.R.