
Statistics
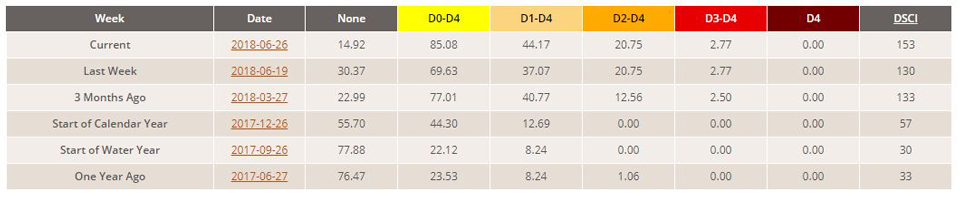
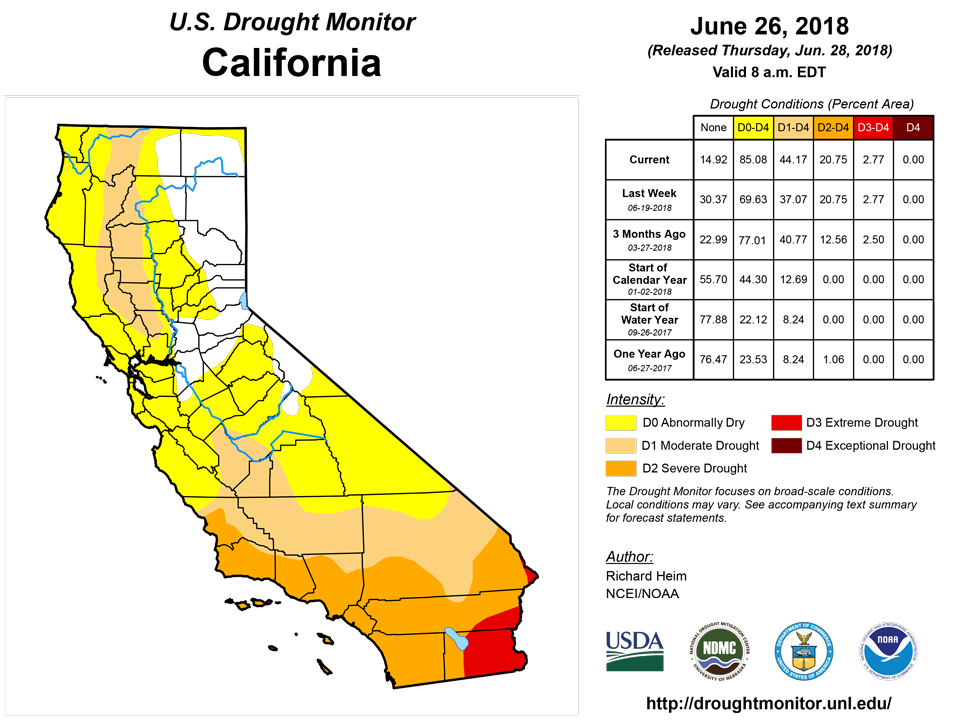
California and National Drought Summary for June 26, 2018
Summary
June 28, 2018 - A couple strong upper-level low pressure systems, moving in the jet stream flow, slowly crossed the northern half of the contiguous U.S. (CONUS) during this U.S. Drought Monitor (USDM) week. The lows dragged surface lows and frontal systems with them. Supplied with abundant Gulf of Mexico moisture, these systems generated numerous mesoscale thunderstorm complexes which dumped heavy rain across parts of the Plains to Midwest and Mid-Atlantic coast. The clouds and rain associated with the lows and fronts also brought cooler-than-normal temperatures to the central Plains to Northeast. A moist low pressure system at the beginning of the week dumped heavy rains along the Texas Gulf coast. Contraction of drought and abnormally dry areas occurred in the Plains and Texas Gulf coast where precipitation was above normal for the week. However, these lows tracked within a larger-scale upper-level ridge system. Drier-than-normal weather dominated much of the West, large parts of Texas and the Southeast States, and from the western Great Lakes to most of the Northeast, with drought and abnormal dryness expanding in parts of the West, South, and Northeast. The week was warmer than normal across much of the West, along the northern tier states, much of Texas, and most of the Southeast.
Northeast
Precipitation amounts ranged from a few tenths of an inch to over an inch in places, but mostly the region was drier than normal. With low streamflow, precipitation deficits building over the last 3 months, and drying soils, D0 was expanded in parts of the region and D1 was introduced from northern Massachusetts to southern Maine. According to June 25 U.S. Department of Agriculture (USDA) statistics, pasture and range condition was poor to very poor across 15% of Massachusetts, 14% of New Hampshire, and 6% of New York. Topsoil moisture was short or very short (dry or very dry) across 40% of Maine, 56% of Massachusetts, 70% of New Hampshire, 52% of New York, and 61% of Vermont. Subsoil moisture conditions were similarly dire. Subsoil moisture was short or very short in 73% of Maine, 21% of Massachusetts, 66% of New Hampshire, 41% of New York, and 36% of Vermont. In New York, according to Farm Service Agency reports, corn was beginning to curl in parts of Oneida and Yates Counties and underseedings were starting to wither in Yates County. Hydrologic conditions in Massachusetts were dry, with below or well below normal groundwater in central and western Massachusetts and low streamflow. Drought impacts reported by the National Drought Mitigation Center (NDMC) include a water ban in Northampton, MA, and water conservation requests by the NH Department of Environmental Services.
Southeast
Two or more inches of rain were observed across much of Virginia, northern Alabama, and parts of the Carolinas and Florida. These areas were wetter than normal for the week. Southern Alabama, the Florida panhandle, and southwest Georgia were substantially drier than normal, while the rest of the Southeast was near to drier than normal. The rains shrank the abnormally dry area in northeast Alabama, but D0 crept into the west central part of the state.
South
Much of coastal Texas was inundated by heavy tropical moisture. Reports of 2 to 5 inches of rain were common, with 5 to 10 inches falling in the southern areas. An automated station near Weslaco Airport recorded 8.39 inches of rain in just 2 and a half hours. According to the Texas mesonet, Weslaco received 9 inches of rain. The average total precipitation is 6.73 inches there for the entire summer (June through August). The rains eliminated dryness on the Standardized Precipitation Index (SPI) drought indictor out to 6 months back in South Texas. The rains led to widespread 1 to 2 category reductions along the coast, with D1-D2 shrinking down to D0 (Abnormally Dry) or to no drought or abnormal dryness (“D-Nothing”).
Meanwhile, several mesoscale thunderstorm complexes over multiple days moved through Oklahoma and clipped the northern Texas panhandle, with their remnants making it into parts of Arkansas, while other thunderstorm systems brought rain to parts of northern Mississippi and southern Tennessee. These areas received 2 inches or more of rain for the week, with parts of Oklahoma recording over 5 inches. The D4 in western Oklahoma and the Texas panhandle was eliminated, improvement occurred in the northern Texas panhandle, and D0-D3 shrank across much of Oklahoma, with some 2-category reductions. Elsewhere in Texas, the week was dry with multi-month precipitation deficits mounting, so D0-D3 expanded across the central half of the state. June 25 USDA statistics indicated that 41% of pastures and rangeland were in poor to very poor condition in Texas. The rains mostly missed northeast Oklahoma, where D1 expanded. D0-D2 expanded in parts of Louisiana, D0-D1 expanded in Mississippi, and there was expansion of drought and abnormal dryness and some contraction, as well, in Arkansas. D0 was added to northern Tennessee, with a little spillage into parts of southern Kentucky, where precipitation deficits have been mounting over the last 3 months.
Midwest
Thunderstorms moving along frontal bands which stretched across the Ohio Valley dumped 2 inches or more of rain in many areas. Most of the rain fell over areas that were not in a drought or abnormally dry status, but some did. D0 was pulled back in central Indiana, southeast Iowa, and northwest Illinois, with D0-D1 contracting in southwest Iowa. Most of Missouri missed the 2-inch rains, with much of the state continuing drier than normal. D0-D2 expanded in the state to better reflect deficits for the last 1 to 3 months and, in places, out to 9 months. Hamilton, in northern Missouri, continued to have hydrologic moisture shortages. According to media reports, the Hamilton Reservoir's current water level sits so low that the city has imposed tough water restrictions. Slivers of D0 from Tennessee extended into southern Kentucky. The western Great Lakes were drier than normal this week. D0 was added in and around the thumb of Michigan where dryness was indicated on the 1- to 2-month SPI.
High Plains
Several rounds of heavy thunderstorms moved along frontal boundaries on multiple days in the High Plains states. Two inches or more of rain was measured across the western two-thirds of Kansas, the eastern half of Nebraska, and in parts of South Dakota, Montana, and Wyoming, with 5 inches or more indicated for southwestern Kansas, eastern Nebraska, and southeast South Dakota. The week was drier than normal for other parts of the High Plains, with western Colorado to southwestern Wyoming receiving little to no precipitation. The rains resulted in pullback of D0-D2 in Kansas, with some 2-category improvements in southwest Kansas, contraction of D0-D1 in Nebraska, and trimming of D0 in South Dakota. With the heavy rains missing eastern Kansas, the week ended drier than normal there, further increasing precipitation deficits for the last 1 to 3 months and, in northeast Kansas, out to 9 months, so D0-D2 were expanded in eastern Kansas. Some of the heavier rains crossed from Kansas into Colorado, but just barely. D2-D3 were pulled back a bit in far eastern Colorado, but the dry conditions further west resulted in D2-D3 expanding in central and west-central Colorado, and D4 expanding in west-central Colorado. June 25 USDA statistics indicated 53% of the pastures and rangeland in Colorado were in poor to very poor condition.
West
Dry weather and mostly warmer-than-normal temperatures dominated the West this week. June 25 USDA statistics indicated that pastures and rangeland were in poor to very poor condition for 90% of the pastures and rangeland in Arizona, 68% in New Mexico, 36% in Utah, 25% in Nevada, and 22% in Oregon. D0 and D1 expanded in parts of Oregon and Washington where streamflow was at near to record low levels for this time of year and SPI values were low for the last 1 to 3 months. The D2 was continued in eastern Oregon. In this region, drought impacts from Baker County include very dry soil conditions, blowing dust, no water for livestock, dry springs and storage ponds, below-normal range grass growth; drought impacts from Harney County include significantly low water supplies from early melt-out of winter snow pack are reducing water available for irrigators and ranchers; and drought impacts from Lake County include reduced water supplies for irrigators and ranchers due to low streamflow and low reservoir storage at some basin reservoirs. In Utah, D2 was expanded in the northeast and new ovals of D3 and D4 were added. But in southwest New Mexico, D1-D3 were pulled back where the rains from Tropical Storm Bud last week were reflected in SPoRT soil moisture and SPI indicators.
Several indicators, including SPI and other precipitation indices, evapotranspiration indices, soil moisture indices, and vegetation indices, showed worsening meteorological conditions in California. June 25 USDA statistics have 75% of topsoil moisture and 75% of subsoil moisture in California short or very short (dry to very dry), with 40% of pastures and rangeland in poor to very poor condition. D0 was expanded in northern and central California, and D1 crept in from the north to capture the extremely low 6- to 12-month SPI values. The water resources of California are carefully managed to mitigate the impacts of drought. With reservoirs in good shape, the D0-D1 in northern California reflects the climatological indicators. D0 was expanded to the California coast to reflect abnormally dry meteorological conditions over the last several months, and a low snowpack during the latter months of the wet season. Since drought impacts along the coast are not happening, the D0 reflects just meteorological conditions and further degradation (to a level of drought, D1) is extremely unlikely there this summer because even zero precipitation over the next few months would not be enough to drop water year precipitation into D1 levels.
Alaska, Hawaii, and Puerto Rico
The weather has been dry across much of Hawaii during the last 2 to 4 weeks. Dry conditions have been noted by the Lanai water company and FSA on Maui, although no agricultural impacts have been reported yet. D0 was expanded across Lanai and Kahoolawe and across the western 2/3 of Maui as a result. The week was drier than normal across most of the panhandle and southeast Alaska stations, and wetter than normal further north and west. Most of Puerto Rico was near to wetter than normal. No changes were made to the USDM depiction for Alaska and Puerto Rico.
Looking Ahead
Since the Tuesday morning cutoff time of this week’s USDM, additional heavy rains have fallen across parts of Missouri, Tennessee, and Kentucky, with rain falling over the East Coast states. For June 28-July 4, dry weather will continue across most of the West and southern Plains. An inch or more of rain is expected for much of the Southeast and New England, and parts of the northern Plains to Upper Midwest. The forecast models predict less than an inch of rain across other parts of the CONUS east of the Rockies. Temperatures are expected to be mostly warmer than normal, except some cooling in the northwestern CONUS. For July 5-11, odds favor above-normal temperatures across most of Alaska and the CONUS, with a chance for below-normal temperatures in the Northwest. There is a higher probability for drier-than-normal weather across the Northwest, central Plains to Great Lakes, and southern Alaska, and wetter-than-normal weather for the Southwest, southern Plains to Mid-Atlantic region, and northern Alaska, as well as the Upper Mississippi Valley.
Author(s):
Richard Heim, NOAA/NCEI
Dryness Categories
D0 Abnormally Dry—used for areas showing dryness but not yet in drought, or for areas recovering from drought.
Drought Intensity Categories
D1 Moderate Drought
D2 Severe Drought
D3 Extreme Drought
D4 Exceptional Drought
Drought or Dryness Types
S Short-Term, typically less than 6 months (e.g. agricultural, grasslands)
L Long-Term, typically greater than 6 months (e.g. hydrologic, ecologic)
Source: National Drought Mitigation Center