
Image Credit: NOAA Climate.gov / Fiona Martin
December 20, 2018 - By Michon Scott - Snowmelt from the Sierra Nevada Mountains provides roughly 75 percent of California’s agricultural water, and 60 percent of Southern California’s water resources. Warm winters can cause snow droughts in the Sierra Nevada, both by nudging precipitation in the direction of rainfall rather than snowfall, and by melting snow sooner. A new study by researchers at the University of California, Irvine, uses historical records and modeling to understand how the Sierra Nevada snowpack may respond to rising temperatures.
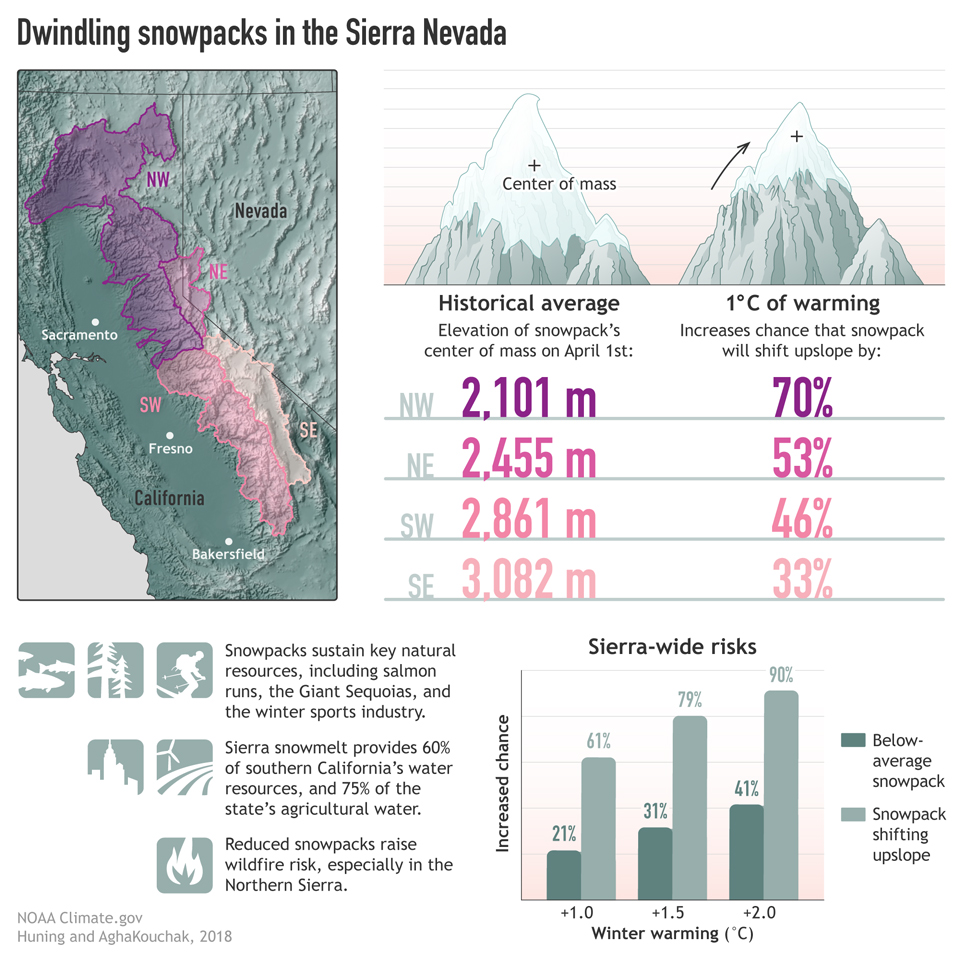
Based on the new study, this figure shows how the snowpack could fare in the Sierra Nevada with a 1°C (1.8°F) increase in average winter air temperature. Hydrologists consider the entire Sierra Nevada mountain range, but also divide the range into four regions: Northwest (NW, purple); Northeast (NE, magenta); Southwest (SW, dark pink); and Southeast (SE, pale pink). The study makes multiple estimates for each subregion. A few of those estimates appear here, all for April 1. That date is generally considered the end of the snow accumulation season and the start of the melt season, although the onset of spring melt varies by year and region.
This image shows the historical average elevation of the snowpack’s center of mass for water years 1985–2016 for each Sierra Nevada subregion, and the chance that the subregion’s center of mass will retreat upslope. Note that the percentages are estimated probability changes, not changes in the center of mass’ movement or elevation. Given a 1°C (1.8°F) increase in average winter temperature, the snowpack is likely to decline, and snowlines are likely to rise to higher elevations.
Subregions in the Sierra Nevada have different responses partly due to differences in elevation. Using the altitude of 2,500 meters (8,200 feet) above sea level as a benchmark reveals substantial regional differences, with subregions having the following percentages of their area located above that elevation: Northwest: 4 percent; Northeast: 16 percent; Southwest: 48 percent; Southeast: 36 percent. Portions of the mountain range with less area at high elevations are more vulnerable to snowpack losses in a warming climate, meaning the northern Sierra Nevada—especially the expansive Northwest subregion—may fare the worst. The study authors also point out that, as the snowpack’s center of mass migrates upslope, changing snow conditions will present new challenges for snowpack observation and forecasting. That’s because in situ observation sites have historically been located at lower elevations.
Across the Sierra Nevada, increases in average temperature bring greater risks of both below-average snowpack and snowpack shifts upslope. The graph in the lower right compares those risks for a temperature increase of 1°C (1.8°F), 1.5°C (2.7°F), and 2.0°C (3.6°F) over the entire mountain range. With 1.5°C of winter warming, the odds that a given year's snowpack will be below average increase by more than 30 percent. With 2.0°C of winter warming, the odds of below-average snowpack rise by more than 40%. These sorts of changes in Sierra snowpack will likely have profound—and expensive—impacts on everything form salmon runs, to ski resorts, to regional fire risk.
Infographic by NOAA Climate.gov / Fiona Martin. This research was funded in part by the Modelling, Analysis, Predictions and Projections (MAPP) division of NOAA's Climate Program Office.
Reference
Huning, L.S., AghaKouchak, A. (2018). Mountain snowpack response to different levels of warming. PNAS. 115 (43), 10932–10937.
Source: NOAA