


California and National Drought Summary for November 19, 2019
Summary
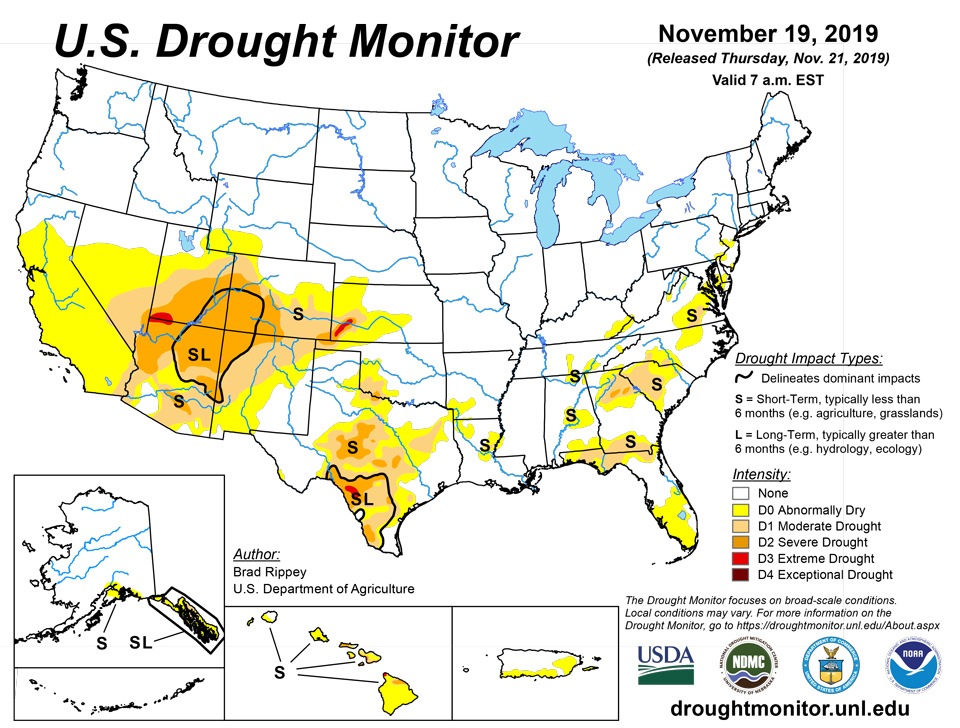
November 21, 2019 - Following a harsh, early-season cold outbreak, which peaked from November 11-14 across the central and eastern United States, temperatures began to rebound. Although cool conditions lingered for several days in the East, above-normal temperatures quickly returned across the nation’s mid-section. In the days following the cold snap, significant precipitation was limited to areas from southern Texas into parts of the Southeast. The rain further eased Southeastern drought that had peaked in coverage and intensity during the first half of October. Meanwhile, patchy, generally light precipitation stretched across the northern U.S., including the Midwest. Higher totals were observed in a few spots, including western Washington and northern New England. Dry weather covered other parts of the country, stretching from California to the central and southern Plains, leading to further development, expansion, and intensification of dryness (D0) and moderate to extreme drought (D1 to D3). In Western drought areas, warm weather aggravated the effects of ongoing dryness. As the drought-monitoring period came to an end, an approaching storm system brought the promise of Southwestern rain and snow—precipitation that will evaluated for next week’s Drought Monitor.
Northeast
Patchy dryness in Delaware, Maryland, New Jersey, Pennsylvania, and West Virginia is the vestige of an early-autumn dry spell. During the drought-monitoring period, cold weather accompanied periodic light precipitation, except for some heavy snow across the northern tier of the region.
Southeast
Abundant precipitation fell in many areas, especially from east-central Alabama to the Atlantic Coast States (from northern Florida to southeastern Virginia). Where the heaviest rain fell, there were generous (up to one category) reductions in the coverage of dryness (D0) and moderate to severe drought (D1 to D2). Jacksonville, Florida, collected a daily-record rainfall total of 3.16 inches on November 15. In Georgia, daily-record amounts included 4.04 inches (on November 16) in Savannah and 2.32 inches (on November 15) on Saint Simons Island. Savannah received 5.35 inches from November 14-16. However, heavy rain bypassed southern Florida, except a few spots along the Atlantic Coast, leaving abnormal dryness (D0) largely intact. One exception was Fort Lauderdale, Florida, where rainfall totaled 4.58 inches from November 13-15.
South
The South had a mix of degradations and improvements. Heavy rain dampened parts of southern Texas, where Harlingen netted 2.69 inches from November 11-14. One of the two remaining areas of extreme drought (D3) in southern Texas was removed due to rain, and reductions in the coverage of moderate to severe drought (D1 to D2) were noted in some areas. Most other areas in the South either continued to experience no drought or had only minor increases in the coverage of dryness and drought. Among areas reporting dry weather during the drought-monitoring period, some of the most serious drought stretched across the Plains from western Oklahoma to central Texas. On November 17, the U.S. Department of Agriculture (USDA) reported that topsoil moisture was 47% very short to short in Oklahoma and 42% very short to short in Texas. On the same date, Texas led the nation with 31% of its winter wheat rated in very poor to poor condition, compared to the national value of 14%.
Midwest
The Midwest remained free of drought amid a period of very cold weather with spotty showers. In fact, issues related to wetness and late crop maturation have contributed to the second-slowest corn harvest in the last 25 years; only 2009 was slower at this point in the season. By November 17, only 76% of the U.S. corn crop had been harvested, compared to the 5-year average of 92%. Currently, the only part of the Midwest experiencing lingering dryness (D0) is a small area in eastern Kentucky.
High Plains
Drought in the High Plains region is limited to southern areas—parts of Colorado and Kansas. However, in areas experiencing drought, the situation continued to worsen. A new sliver of extreme drought (D3) was added in southwestern Kansas, where several locations have reported less than one-half inch of precipitation since September 1. Specifically, September 1 – November 19 precipitation in Kansas totaled 0.32 inch near Ulysses (Grant County); 0.40 inch near Lakin (Kearny County); and 0.48 inch at the Garden City Experiment Station (Finney County). Those values are less than 15% of normal. In the driest areas, winter wheat has struggled to emerge and become established, with the recent cold wave being a complicating factor. Overall, Kansas’ winter wheat was rated 18% very poor to poor on November 17, up from 13% at the end of October. On the same date, statewide topsoil moisture was 47% very short to short in Kansas and 44% very short to short in Colorado.
West
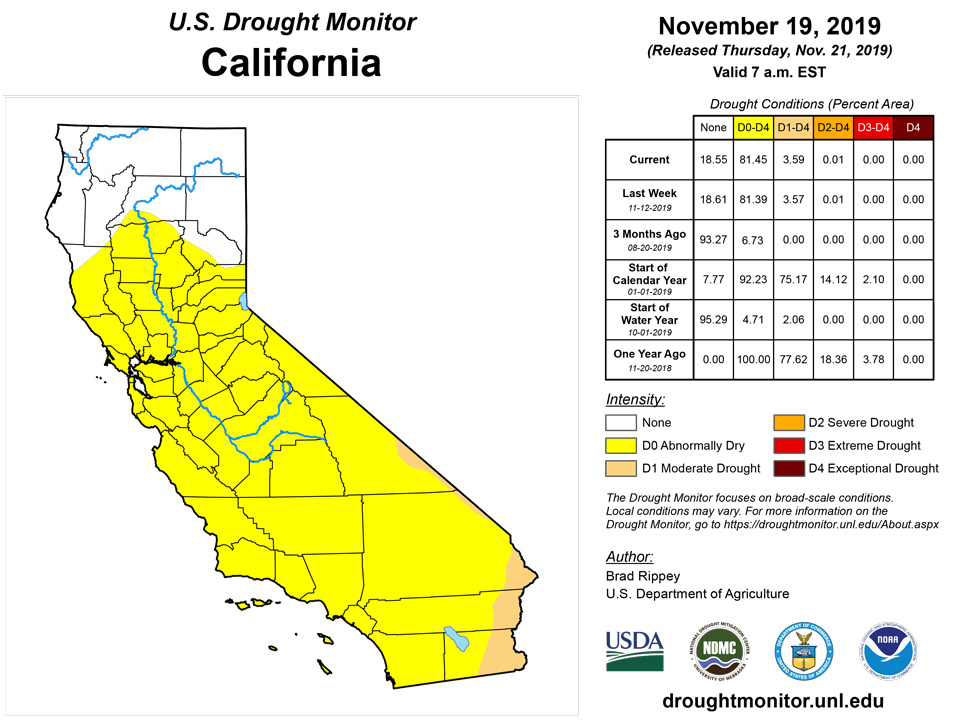
The end of this monitoring period (early November 19) came at an interesting time for southern California, the Great Basin, and the Southwest, as significant precipitation arrived the following day. Any impact of the precipitation on Western drought will be reflected next week. On November 19, however, Saint George, Utah, marked its 155th consecutive day without measurable rain—erasing a record originally set with a 121-day dry spell from September 8, 1929 – January 6, 1930. In other Southwestern areas where monsoon rains (largely) failed to materialize, moderate to severe drought (D1 to D2) has developed. A new area of extreme drought (D3) was introduced in a small area centered on southwestern Utah and northwestern Arizona. The drought is also being reflected in soil moisture shortages and poor vegetation health. According to USDA, California’s “foothill rangeland and non-irrigated pasture(s) were reported to be in poor condition.” One November 17, three-quarters of Arizona’s rangeland and pastures were rated in very poor to poor condition. USDA noted that topsoil moisture was rated 80% very short to short in California, along with 60% in New Mexico and 50% in Nevada. Subsoil moisture was similarly very short to short in many of the same states—80% in California, 66% in New Mexico, and 35% in Nevada. Farther north, there have been periodic autumn storms, although some Northwestern areas are being monitored for the need to introduce abnormally dry conditions. On the 17th, topsoil moisture was rated 45% very short to short in Oregon.
Alaska, Hawaii, and Puerto Rico
Significant snow fell across parts of south-central Alaska, including the Anchorage area, on November 16. This snow, combined with earlier precipitation, led to the removal of the remaining area of moderate drought (D1) from that region. Anchorage, which received 8.4 inches of snow on the 16th, reported above-normal precipitation from November 1-19 (1.35 inches, or 182% of normal) and September 1 – November 19 (6.98 inches, or 121%). November has also featured heavy precipitation in southeastern Alaska. Some D1 was also removed in southeastern Alaska, where heavy precipitation has occurred in recent weeks and drought impacts—such as reductions in the capability for hydroelectric power generation due to low lake levels—have diminished. During the first 19 days of November, precipitation totaled 18.49 inches (167% of normal) in Ketchikan; 11.28 inches (123%) in Yakutat; 10.24 inches (162%) in Sitka; and 6.48 inches (171%) in Juneau. Year-to-date precipitation in Ketchikan, 122.68 inches through the 19th, has climbed slightly above the normal value of 121.48 inches. Meanwhile, the first half of November was extremely dry across nearly all of Hawaii. On the Big Island, Hilo received rainfall totaling just 0.04 inch (7.80 inches below normal) from November 1-15. However, toward the end of the drought-monitoring period, a “cut-off” low-pressure system produced locally heavy rain in several areas. Hilo’s November 16-19 rainfall totaled 2.67 inches, but much higher totals were reported in some windward locations. On Kauai, for example, 24-hour totals on November 16-17 reached 4 to 8 inches or more at several reporting sites. Due to Hawaii’s sudden transition to wetter weather, a planned statewide introduction of abnormal dryness (or worse) was tempered to include only those areas that retained short-term dryness. Elsewhere, the depiction of abnormal dryness (D0) remained unchanged in Puerto Rico, although short-term rainfall deficits across the eastern highlands and along portions of the northeastern coast are being monitored. D0 was introduced, however, across neighboring Vieques.
Pacific Islands
The weather pattern over Micronesia during this USDM week (11/13/19-11/19/19) consisted of a monsoon trough which stretched across Micronesia at mid-week and several other surface troughs across western and eastern portions of the USAPI. Tropical Storm Fengshen moved across the northern Marianas at the beginning of the week before intensifying into a typhoon over the Philippine Sea. Several other weak circulations and tropical disturbances moved across Micronesia during the week. Near the end of the week, modest converging trade winds brought rain to some areas while a shear line moved across the northern Marianas. South of the equator, high pressure systems south of the Samoan Islands kept a trough nearly stationary north of the islands.
Satellite-based estimates of 7-day precipitation (QPE) showed a band of 1-2 inches of precipitation, with localized areas of 2 to 4+ inches, across Micronesia from north of Yap southeastward to the southern Marshall Islands. Generally less than an inch was indicated north and south of this band, except 2+ inches were seen over the northern Marianas and near the equator in far southern Pohnpei and Kosrae States. The satellite QPE showed areas of 1+ inches of rain surrounding the main Samoan Islands which had little to no rain indicated.
In the Republic of Palau, the Palau International Airport reported 0.82-inch of rain during the current drought week (November 13-19). Koror received 10.21 inches of rain so far this month, which is 134.9 percent of normal for this period. Year-To-Date (YTD) rainfall is 156.28 inches, which is 119.0 percent of normal for the corresponding period. Despite relatively dry conditions at the Palau International Airport this week (under 2 inches), the Month-To-Date (MTD) and Year-To-Date (YTD) rainfall surpluses at Koror support the continuation of drought-free conditions in Palau.
In the Federated States of Micronesia (FSM), Woleai reported 1.84 inches of rain this week, which falls a bit short of the 2-inch weekly minimum necessary to meet most water needs. For the past twelve months (dating back to December 2018), two of those months saw less than 3 inches of rain, three months had in excess of 8 inches of rain, and seven months had 4-8 inches of rain. Woleai's drought designation remains at D0 with short-term impacts. Yap observed a wet week (4.33 inches, 1 day missing), receiving more than twice the weekly minimum rainfall necessary to address most water needs. In sharp contrast, Chuuk Lagoon received only 0.21-inch of rain this week (1 day missing), falling well short of the 2-inch weekly minimum. However, during 8 of the past 12 months Chuuk Lagoon registered above (and in some cases, well above) the 8-inch minimum monthly rainfall requirement to meet most water needs. For the remaining 4 months, precipitation amounts ranged between 4.73-5.99 inches, so there is no need to change its drought-free status at this time. Weekly rainfall totals for Lukunor, Nukuoro, Kapingamarangi, Pohnpei and Kosrae were 0.29-inch (1-day missing), 3.19 inches, 4.00 inches, 0.67-inch, and 2.81 inches, respectively. The more southern stations (Nukuoro, Kapingamarangi, and Kosrae) fell within the heavy rain band described earlier in the QPE section. With the exception of Lukunor (D0(S)), the other stations noted remain drought-free. The stations of Ulithi, Fananu, and Pingelap did not report this week.
Guam received 1.15 inches of rain, which exceeds the 1-inch weekly minimum required to meet most water demands. Weekly rainfall totals at Guam for the past 12 weeks have all been over an inch, and 8 of the past 12 months have exceeded the monthly minimum criterion of 4 inches. In the Commonwealth of the Northern Mariana Islands (CNMI), Rota observed 1.33 inches of rain this week, and has exceeded the 1-inch weekly requirement during 11 of the past 12 weeks. Rainfall totals for the week in Saipan fell short of the 1-inch cutoff, with a manual gauge reporting 0.88-inch, ASOS reporting 0.81-inch, and the National Park Service registering 0.69-inch of rain. Tinian reported 0.50-inch of rain this week, though there were 3 days of missing data. No changes were made to Guam or the CNMI stations this week regarding their drought-free status.
In the Republic of the Marshall Islands (RMI), Kwajalein received 1.00-inch of rain during the drought week, which is one-half of the minimum required to satisfy most water needs. Jaluit is being classified as "No Data" until a rain gauge issue can be resolved. Rainfall amounts received at Ailinglapalap, Utirik, Wotje, Majuro, and Mili were 1.93 inches, 3.44 inches (1 day missing), 0.00-inch (2 days missing), 2.67 inches, and 4.96 inches, respectively. In Utirik, 9 of the past 12 weeks have been wet, though only 3 of the past 12 months have been wet (August, September, and November). Clearly, Utirik's rainfall distribution has been "back-loaded", where the bulk of the rainfall during the past year is concentrated within the most recent 4 months. The same pattern has also been observed at Wotje, where 3 of the 4 most recent months were wet. In contrast, the rainfall distribution at Mili has been systematically tilted wet throughout most of the past 12 weeks and 12 months.
A relatively dry week prevailed in American Samoa with Pago Pago receiving only 0.33-inch of rain (1 day missing), Siufaga Ridge (a National Park Service site) reporting 0.59-inch, and Toa Ridge (another National Park Service site) registering only 0.02-inch of rain. Tutuila in American Samoa retains its drought-free status for the time being.
Virgin Islands
The Cyril E. King Airport in St. Thomas (USVI) received 0.45-inch of rain this week. Month-To-Date (MTD) rainfall is 2.67 inches, and the normal for this period is 3.68 inches. This equates to 72.6 percent of normal. Since September 1st, King Airport received 8.79 inches of rain, which is 59.9 percent of normal for this period. A YTD rainfall total of 31.72 inches registers at 91.1 percent of normal. According to CoCoRaHS data, Anna's Retreat (VI-ST-1) received 0.13-inch of rain this drought week, and 1.60 inches for the month so far. At the beginning of the drought week, November 13th, the Grade School 3 Well in Charlotte Amalie indicated a water depth (below the land surface) of about 9.25 feet. By week's end, November 19th, the water depth had dropped to nearly 10 feet. Since the beneficial tropical rains in late August, this represents a drop of about 6 feet in well water depth. For Charlotte Amalie, the SPI values at 1,3,6,9, and 12 months are -0.74, -0.48, +0.17, -0.32, and -0.67, respectively. From these SPI values, it seems that St. Thomas's drought-free designation is still valid.
The Henry E. Rohlsen Airport in St. Croix (USVI) received 0.20-inch of rain this week. The MTD rainfall total of 2.04 inches translates to 53.5 percent of normal for the period. Since the first of September, Rohlsen Airport received 5.04 inches of rain, which is 36.2 percent of normal. The YTD rainfall total of 21.52 inches translates to 63.2 percent of normal for the period. CoCoRaHS data for Christiansted (VI-SC-8) indicates 0.32-inch of rain fell during the week, and 1.40 inches of rain fell during the month so far. The water depth in the Adventure 28 Well in St. Croix remained relatively stable this week, fluctuating slightly about the 20.08 foot level. For Christiansted, the SPI values at 1,3,6,9, and 12 months are -0.95, -1.45, -0.79, -0.86, and -1.53, respectively. Moderate drought with short-term and long-term impacts (D1(SL)) continues this week in St. Croix.
An observer at Windswept Beach, St. John (USVI), reported 0.09-inch of rain this week. The YTD accumulation is 33.28 inches. The Sep-Oct-Nov (SON) season is climatologically a wet time of year, though this year the month of November (so far) has experienced a dry spell. This does not bode well for soon going into the dry season. The USGS Susannaberg Well on St. John is currently reporting a water depth of about 12.5 feet below the land surface, and has dropped about one foot in the past month. Considering these factors, it was decided to revise St. John's drought designation to D0(S) this week.
Looking Ahead
A complex, two-part storm system will emerge from the Southwest during the next several days. Storm-total precipitation through Friday could reach 1 to 3 inches in portions of southern California, the Great Basin, and the Southwest, providing drought relief but possibly resulting in flash flooding and debris flows—especially in areas that have experienced wildfires in recent weeks. Meanwhile, a low-pressure system will cross the Midwest on Thursday and early Friday, delivering rain and wet snow and bringing renewed fieldwork delays. Farther south, another piece of the storm system should result in showers and thunderstorms, starting on Thursday across the southern Plains and shifting into the East during the weekend. Five-day rainfall amounts could total 1 to 2 inches or more in parts of the South. In contrast, mostly dry weather will prevail during the next 5 days in the lower Rio Grande Valley, southern Florida, and from northern California to the northern High Plains.
The NWS 6- to 10-day outlook for November 26 – 30 calls for the likelihood of colder-than-normal conditions across the western half of the country, while above-normal temperatures will cover the East and areas along the Gulf Coast. Meanwhile, wetter-than-normal weather across most of the nation should contrast with below-normal rainfall in central and southern Texas.
Author(s):
Brad Rippey, U.S. Department of Agriculture
Anthony Artusa, NOAA/NWS/NCEP/CPC
Dryness Categories
D0 Abnormally Dry—used for areas showing dryness but not yet in drought, or for areas recovering from drought.
Drought Intensity Categories
D1 Moderate Drought
D2 Severe Drought
D3 Extreme Drought
D4 Exceptional Drought
Drought or Dryness Types
S Short-Term, typically less than 6 months (e.g. agricultural, grasslands)
L Long-Term, typically greater than 6 months (e.g. hydrologic, ecologic)
Source: National Drought Mitigation Center
