
IMPORTANT NOTE: The employment data for the month of August 2020 is taken from the survey week including August 12. Data for the survey week including September 12 is scheduled for release on October 16.
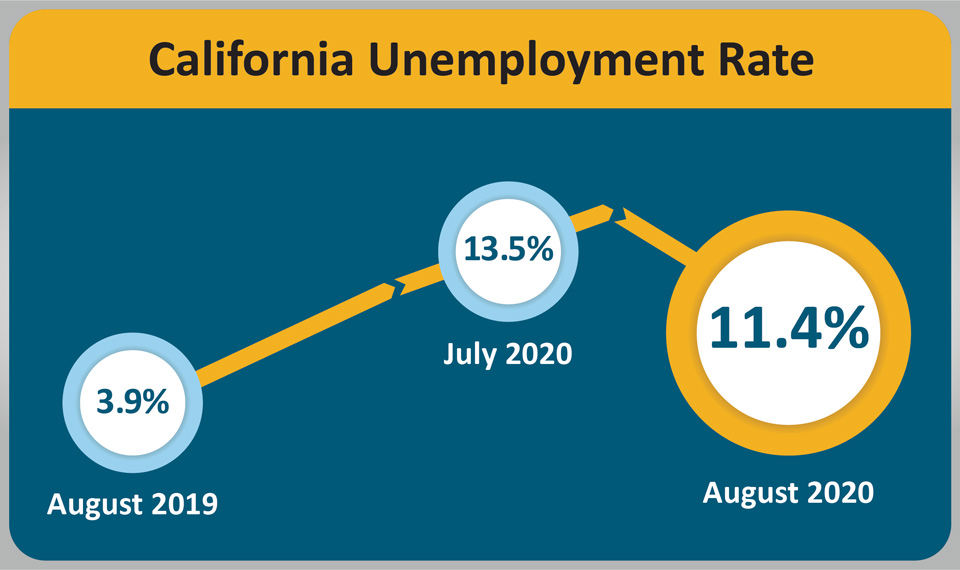
September 21, 2020 - SACRAMENTO – California’s unemployment rate improved to 11.4 percent in August as the state’s employers added 101,900 jobs1, according to data released on Friday by the California Employment Development Department (EDD) from two surveys. This comes after July’s downward-revised gain of 83,500 jobs (-23,600 jobs from previously reported gain). California has now regained nearly a third (33.9 percent) of the 2,615,800 nonfarm jobs lost during March and April as a direct result of the COVID-19 pandemic.

California’s Labor Market, by the Numbers...
- August’s unemployment rate of 11.4 percent2 marked the first month since March 2020 that California’s unemployment rate was lower than the 12.3 percent mark set during the height of the Great Recession (March, October, and November 2010).
- The month-over decrease in California’s unemployment rate (-2.1 percentage points) was larger than that of the nation as a whole (-1.8 percentage points).
- Six of California’s 11 industry sectors gained jobs last month. Government (+66,100) had the largest job gain due to federal temporary hiring for the 2020 Census and growth in local government education. Trade, Transportation, & Utilities’ increase (+26,000) was buoyed by Transportation and Warehousing and general merchandise stores.
- Leisure and Hospitality posted the largest industry job loss in August (-14,600), and 561,900 of the sector’s 633,000 year-over job losses have occurred since March 2020.
1. The nonfarm payroll job numbers come from a federal survey of 80,000 California businesses.
2. The unemployment rate comes from a separate federal survey of 5,100 California households.
Data Trends about Jobs in the Economy
Total Nonfarm Payroll Jobs
This information comes from a monthly survey of approximately 80,000 California businesses that estimates jobs in the economy – seasonally adjusted.
- Month-over – Total nonfarm jobs in California’s 11 major industries totaled 15,874,400 in August – a net gain of 101,900 jobs from July. This followed a downward- revised (-23,600) gain of 83,500 jobs in July.
- Year-over – Total nonfarm jobs decreased by 1,598,200 (a 9.1 percent decrease) from August 2019 to August 2020 compared to the U.S. annual loss of 10,246,000 jobs (a 6.8 percent decrease).

Total Farm jobs – The number of jobs in the agriculture industry decreased by 3,400 from July, to 326,800 jobs in August 2020. The agricultural industry has lost 101,100 farm jobs since August 2019.
Data Trends about Workers in the Economy
Employment and Unemployment in California
This information is based on a monthly federal survey of 5,100 California households which focuses on workers in the economy.
- Employed – The number of Californians holding jobs in August was 16,574,300, an increase of 291,700 jobs from a downward-revised (-11,300) July, but down 2,081,600 from the employment total in August of last year.
- Unemployed – The number of unemployed Californians was 2,134,600 in August, a decrease of 408,700 over the month, but up by 1,370,800 compared with August of last year.

Unemployment Insurance Claims (Not Seasonally Adjusted)
The following data is from a sample week that includes the 19th of each month: In related data that figures into the state’s unemployment rate, there were 2,837,209 people certifying for Unemployment Insurance benefits during the August 2020 sample week. That compares to 3,144,098 people in July 2020 and 309,691 people in August 2019. Concurrently, 196,855 initial claims were processed in the August 2020 sample week, which was a month-over decrease of 47,651 claims from July 2020, but a year-over increase of 162,080 claims from August 2019.

| COUNTY | LABOR FORCE | EMPLOYMENT | UNEMPLOYMENT | RATE |
|---|---|---|---|---|
| STATE TOTAL | 18,729,400 | 16,557,600 | 2,171,800 | 11.6% |
| ALAMEDA | 806,200 | 727,100 | 79,200 | 9.8% |
| ALPINE | 460 | 410 | 50 | 11.2% |
| AMADOR | 14,200 | 12,880 | 1,320 | 9.3% |
| BUTTE | 93,200 | 84,800 | 8,400 | 9.0% |
| CALAVERAS | 20,570 | 19,020 | 1,550 | 7.5% |
| COLUSA | 10,070 | 8,970 | 1,100 | 11.0% |
| CONTRA COSTA | 535,700 | 483,200 | 52,400 | 9.8% |
| DEL NORTE | 9,370 | 8,490 | 880 | 9.4% |
| EL DORADO | 88,500 | 81,400 | 7,100 | 8.0% |
| FRESNO | 444,200 | 395,800 | 48,400 | 10.9% |
| GLENN | 12,410 | 11,400 | 1,010 | 8.1% |
| HUMBOLDT | 59,200 | 54,200 | 4,900 | 8.4% |
| IMPERIAL | 69,200 | 53,400 | 15,900 | 22.9% |
| INYO | 8,190 | 7,580 | 610 | 7.4% |
| KERN | 370,700 | 322,200 | 48,500 | 13.1% |
| KINGS | 55,500 | 49,600 | 5,900 | 10.7% |
| LAKE | 28,640 | 26,100 | 2,530 | 8.8% |
| LASSEN | 8,970 | 8,370 | 600 | 6.7% |
| LOS ANGELES | 4,929,600 | 4,111,400 | 818,300 | 16.6% |
| MADERA | 61,800 | 55,600 | 6,200 | 10.0% |
| MARIN | 132,400 | 123,200 | 9,300 | 7.0% |
| MARIPOSA | 7,790 | 7,130 | 670 | 8.5% |
| MENDOCINO | 36,840 | 33,620 | 3,230 | 8.8% |
| MERCED | 113,200 | 100,400 | 12,800 | 11.3% |
| MODOC | 3,060 | 2,860 | 210 | 6.8% |
| MONO | 6,890 | 6,090 | 800 | 11.6% |
| MONTEREY | 195,400 | 177,100 | 18,300 | 9.4% |
| NAPA | 71,600 | 65,600 | 5,900 | 8.3% |
| NEVADA | 45,510 | 41,860 | 3,650 | 8.0% |
| ORANGE | 1,556,200 | 1,402,400 | 153,800 | 9.9% |
| PLACER | 181,000 | 167,000 | 14,000 | 7.7% |
| PLUMAS | 7,890 | 7,240 | 650 | 8.2% |
| RIVERSIDE | 1,082,900 | 962,100 | 120,700 | 11.2% |
| SACRAMENTO | 701,900 | 629,500 | 72,400 | 10.3% |
| SAN BENITO | 30,400 | 27,600 | 2,800 | 9.2% |
| SAN BERNARDINO | 949,900 | 847,600 | 102,400 | 10.8% |
| SAN DIEGO | 1,559,100 | 1,404,700 | 154,300 | 9.9% |
| SAN FRANCISCO | 565,700 | 515,900 | 49,800 | 8.8% |
| SAN JOAQUIN | 322,100 | 283,700 | 38,400 | 11.9% |
| SAN LUIS OBISPO | 129,600 | 119,500 | 10,200 | 7.8% |
| SAN MATEO | 440,500 | 407,600 | 33,000 | 7.5% |
| SANTA BARBARA | 210,600 | 193,800 | 16,800 | 8.0% |
| SANTA CLARA | 1,024,100 | 947,200 | 76,900 | 7.5% |
| SANTA CRUZ | 130,900 | 119,600 | 11,300 | 8.6% |
| SHASTA | 72,700 | 66,700 | 6,000 | 8.3% |
| SIERRA | 1,220 | 1,120 | 90 | 7.7% |
| SISKIYOU | 15,790 | 14,350 | 1,440 | 9.1% |
| SOLANO | 201,700 | 181,000 | 20,700 | 10.3% |
| SONOMA | 252,000 | 232,500 | 19,500 | 7.7% |
| STANISLAUS | 236,000 | 210,300 | 25,700 | 10.9% |
| SUTTER | 41,800 | 37,300 | 4,400 | 10.7% |
| TEHAMA | 24,310 | 22,170 | 2,140 | 8.8% |
| TRINITY | 4,510 | 4,200 | 310 | 6.8% |
| TULARE | 189,400 | 164,600 | 24,800 | 13.1% |
| TUOLUMNE | 19,560 | 17,560 | 2,000 | 10.2% |
| VENTURA | 406,500 | 369,600 | 36,900 | 9.1% |
| YOLO | 103,800 | 96,000 | 7,800 | 7.5% |
| YUBA | 28,000 | 25,000 | 3,000 | 10.8% |
Source: EDD