
California and National Drought Summary for November 24, 2020
Summary
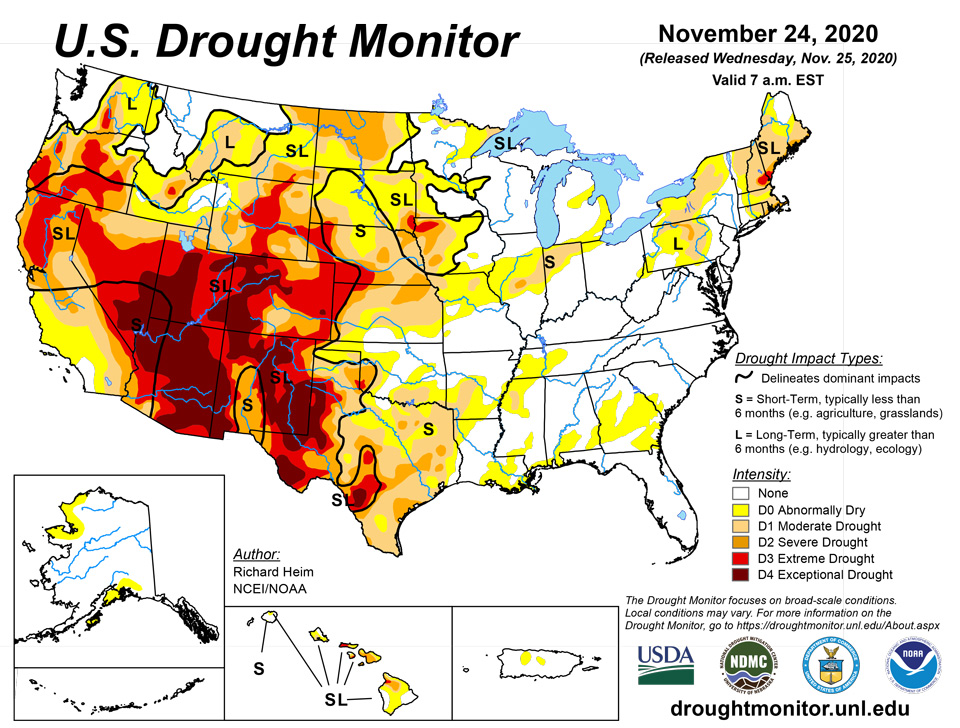
November 25, 2020 - Several Pacific weather systems, in the form of shortwave troughs, moved in the jet stream flow across the contiguous U.S. (CONUS) during this U.S. Drought Monitor (USDM) week. The weather systems brought rain or snow to parts of northern California and the Pacific Northwest, western Colorado, the northern Plains to Mid-Mississippi Valley, and Tennessee Valley to Northeast. Rain also fell across parts of Florida. The rest of the CONUS had little to no precipitation. Even where the precipitation fell, it was mostly below normal for the week. Areas receiving above-normal precipitation included parts of the Sierra Nevada, southern Idaho, other scattered parts of the Pacific Northwest, strips across the central Palins to Ohio Valley and across New England, and parts of Hawaii. Improvement in drought conditions occurred where precipitation was above normal, while drought expanded or intensified in some areas where dryness continued. Temperatures were largely warmer than normal across the CONUS, with anomalies 9 degrees F or warmer from the Southwest to northern Plains. Parts of the Pacific Northwest and East Coast were near to cooler than normal. SNOTEL observations of mountain snowpack showed increases in snow depth in the Sierra Nevada and parts of Oregon and Washington, and snow water equivalent (SWE) values were in the high percentiles in the Sierra Nevada, and Pacific Northwest, but this is early in the snow season when the snowpack is just getting established. SWE values were in the low percentiles from Nevada eastward. Western reservoirs continued quite low, especially in Oregon, California, Nevada, Utah, Colorado, Wyoming, and New Mexico. Mounting dryness was indicated in several drought indicators and indices. Maps of 7-day, 14-day, and 28-day USGS streamflow measurements were consistent in showing below-normal streamflow from northern California, Nevada, and southern Idaho, across the Southwest, to the central and southern High Plains; across southern Texas; across western Puerto Rico; and in parts of Hawaii, Iowa, Illinois, Indiana, and the Northeast. The satellite-based Vegetation Health Index shows stressed vegetation across the California valleys and southern California, the Southwest, parts of the central Plains and Ohio Valley, and especially in southeastern New Mexico to western Texas. Where VegDRI is still in season, it shows drought across much of the West (especially the Southwest and west Texas) and parts of the Northeast. Where QuickDRI is still in season, it shows very dry conditions across the West (except for a very small part of coastal southern California) to southern and central Plains; much of Texas, and parts of the Midwest and Northeast. The KBDI shows significantly dry conditions in California, Nevada, Utah, Arizona, New Mexico, and Texas. Evapotranspiration (EDDI) for the last week has been high in the southern to central Plains, southern Alabama, and the Midwest to Northeast; at the 2- to 3-week timescales, across much of the CONUS from the Southwest to Northeast; and at longer time scales (1-3 months), in the Southwest to central Plains, and from the Ohio Valley and southern Great Lakes to Northeast. NIFC wildfire maps show large wildfires still burning in California and Colorado, several across Oklahoma, and some in other parts of the West, Kansas, Texas, Mississippi, the Florida panhandle, and central Appalachians. USGS real-time groundwater level data show low groundwater at points across the West, in northern Indiana, southern Georgia, and parts of the Northeast. NASA GRACE satellite-based groundwater estimates show low groundwater across most of the West to central and southern High Plains, most of New York to New England, much of Texas, and parts of North Dakota, Pennsylvania, Virginia, Alabama, and Florida. Soil moisture is dry across the West from California to the southern and central Rockies, in the southern and central High Plains, in North Dakota, across Nebraska and Iowa, across central Illinois to northern Indiana, parts of Pennsylvania and New York, and (for some indicators) most of New England and southern Alabama (CPC, NLDAS, and UCLA/VIC models; satellite-based AAFC/SMOS, GRACE, and NASA/SPoRT analyses). The Standardized Precipitation Index (SPI) shows dry conditions in various places at different time scales. These include North Dakota to Minnesota, Wyoming, New England, and southern Texas to the Lower Mississippi Valley (at the 1-month time scale); California to the central and southern Rockies, much of the Great Plains, Iowa and Missouri to Indiana, parts of the Northeast, and southern AL (2 to 4 months); California to the central and southern Rockies, much of the Great Plains, Iowa, Indiana to Ohio and Michigan, most of Northeast (6 to 12 months); parts of Pacific Northwest (9 to 12 months); and the Southwest to southern and central High Plains, and parts of Pacific Northwest, Texas, Iowa, Indiana, and the Northeast (24 months). When the desiccating effects of hot temperatures are included, the Standardized Precipitation Evapotranspiration Index (SPEI) shows more intense drought conditions over the SPI dry areas than indicated by the SPI.
Northeast
Locally over 2 inches of precipitation fell across parts of New England this week, with other parts of the Northeast receiving half an inch or more. Slight improvements were made in Pennsylvania and New York. Moderate and severe were trimmed in southern New England, and abnormal dryness pulled back in northern Maine. According to U.S. Department of Agriculture (USDA) reports, 88% of the topsoil moisture in New Hampshire continued to be short or very short (dry to very dry).
Southeast
Locally 2+ inches of rain was measured along parts of the Florida east coast and half an inch touched parts of the North Carolina coast. The rest of the Southeast was dry this week with virtually no rain falling. Abnormal dryness expanded in Georgia and was added to southern Alabama, reflecting dryness of the last one to two months. According to USDA reports, 45% of the topsoil moisture in Georgia and 33% of the topsoil moisture in Alabama was short or very short. These accounted for jumps of 28% in Georgia and 16% in Alabama compared to a week ago.
South
Half an inch or more of rain fell across parts of Oklahoma and Arkansas, but other than that the South region was dry. Abnormal dryness expanded in parts of all of the states in the South region. Moderate to exceptional drought were expanded across various parts of Texas; moderate drought was introduced in Arkansas and Mississippi and expanded in Louisiana; and moderate and severe drought expanded in Oklahoma. In the Oklahoma panhandle, moderate and severe drought retreated. According to USDA reports, topsoil moisture was short or very short across 69% of Texas, 41% of Oklahoma, 31% of Mississippi, 24% of Louisiana, and 14% of Arkansas; 38% of the winter wheat was in poor to very poor condition across Texas.
Midwest
Parts of the Midwest benefited from above-normal precipitation this week. Half an inch or more of precipitation was widespread across Missouri and parts of southern Iowa eastward to Ohio, with an inch to locally over 2 inches from southern Missouri to southern Indiana. Less than half an inch of precipitation occurred over northern parts of the region. Abnormal dryness was trimmed in Illinois, Indiana, and Ohio, but expanded to the north in parts of Illinois and southeast Iowa. Abnormal dryness and moderate drought retreated in southwest Missouri.
High Plains
Half an inch of precipitation fell over parts of western Wyoming and the Colorado mountains, with a strip of half-inch precipitation bisecting Kansas. But for most of the region, it was a dry week with less than a quarter inch falling or no precipitation. Moderate and severe drought was trimmed slightly in western Wyoming, but the big story was expansion of severe and extreme drought in parts of Kansas and Nebraska; moderate drought also expanded in eastern Kansas. This expansion was prompted by several indicators, including SPI at several time scales and multiple soil moisture tools. According to USDA reports, half to two-thirds of the topsoil moisture was short to very short in all of the High Plains states except Colorado, where 87% of the topsoil moisture was short to very short. USDA statistics show that 43% of the winter wheat was in poor to very poor condition in Colorado, which is a jump of 11% compared to a week ago. In Nebraska and Kansas, the winter wheat statistics were 20% and 26%, respectively, poor to very poor.
West
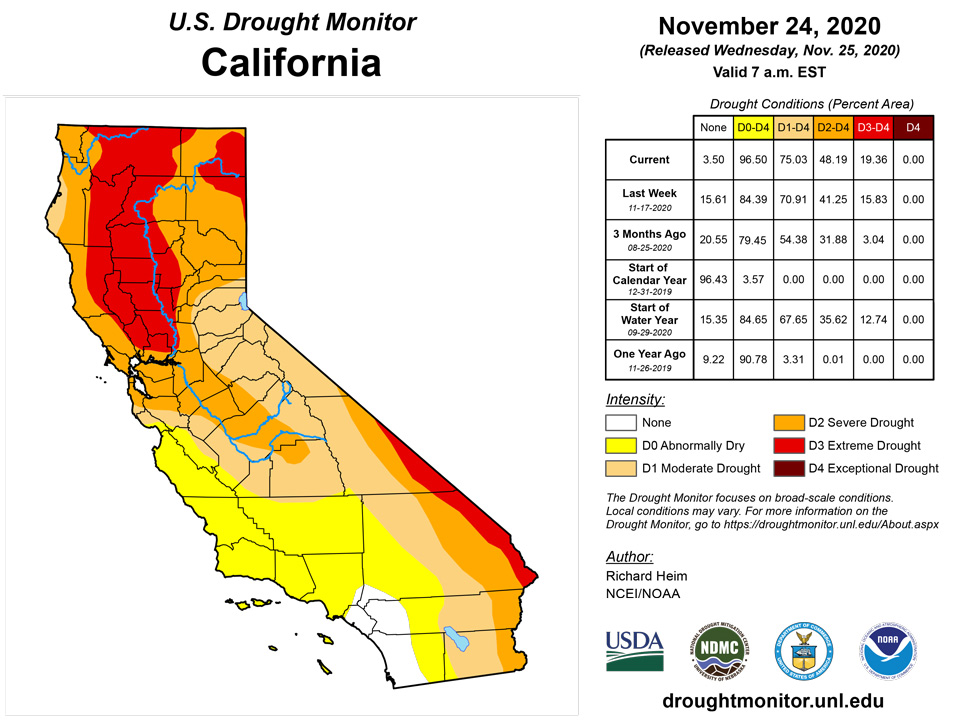
Parts of northern California and the Sierra Nevada and the western parts of Oregon and Washington received half an inch to over 2 inches of precipitation this week, with locally over 4 inches in Oregon and Washington. Parts of the Rocky Mountains received half an inch to 2 inches. While beneficial, the precipitation was not enough to overcome deficits that have built up over much of 2020. An exception was contraction of abnormal dryness in a couple spots in Washington. Moderate drought retreated in central Montana, reflecting moisture which has fallen in recent weeks. Severe to extreme drought were expanded in parts of northeast California, northwest Nevada, and adjacent Oregon where precipitation this week was light and deficits over the last several months continued to mount.
Southern portions of the West region received little to no precipitation this week. Moderate to severe drought expanded in the San Joaquin Valley and abnormal dryness expanded in southern California. The failure of the summer monsoon resulted in record dryness to the Southwest states, and record heat over warm season increased evapotranspiration, resulting in record SPEI values over the last 3 to 6 to 9 months. The SPEI values were not only record, they exceeded previous records by huge margins. Extreme to exceptional drought expanded to reflect this prolonged dryness in Arizona, New Mexico, and Nevada. According to USDA reports, topsoil moisture was short to very short across 81% of New Mexico, 75% of California and Utah, 58% of Montana, 55% of Idaho, and 40% of Nevada and Oregon. Parts of interior southern California, the southern Great Basin, and the Desert Southwest have had a seven-month dry streak. According to National Weather Service records, the last measurable precipitation in Bishop, California occurred on April 17, 2020, and the last measurable precipitation in Las Vegas, Nevada occurred on April 20, 2020.
Alaska, Hawaii, and Puerto Rico
No change was made to the depiction in Alaska. A spot of abnormal dryness was added in western Puerto Rico where streamflow was below normal and precipitation was drier than normal for the last 7 to 90 days. Hawaii experienced strong and wet trade winds over the past week, with the windward slopes of the Big Island reporting 5 to 10+ inches of rain. This has helped ease some agricultural and hydrologic drought, especially along the northeast-facing windward slopes of the state. Abnormal dryness and moderate to extreme drought were pulled back on parts of the main islands.
Pacific Islands
Satellite-based estimates of 7-day precipitation (QPE) showed rainfall of an inch over most of the American Pacific Islands, with areas of heavier precipitation exceeding 4 inches from about 4 to 10 N and 155 E to the International Date Line. In the vicinity of American Samoa, rainfall ranged from roughly an inch to more than 4 inches.
The Republic of Palau was free of dryness for another week. The Palau International Airport received 1.79 inches of rain, while the Koror COOP received 2.10 inches.
The Mariana Islands remained free of dryness and received ample rainfall for the week. Guam and Rota received 1.51 inches and 2.86 inches respectively, which exceeded the weekly minimum of an inch to supply most water needs. The measurements for Saipan were 1.98 inches at the International Airport, 1.45 inches at Saipan ASOS, and 2.18 inches at Saipan NPS.
The Federal States of Micronesia remained free of dryness, apart from Kapingamarangi, which continued at D4. Most locations reported ample rainfall, ranging from 2.5 to 6 inches, except for Kapingamarangi, Nukuoro and Woleai, which reported 0.00, 0.40 and 0.54 inches, respectively. Kapingamarangi water catchments and ground wells were affected by months of below normal rainfall, leaving supplies inadequate and unsafe to drink as wells suffered from saltwater intrusion. Taro patches and coconuts were half damaged, while bananas and breadfruit were all damaged. Some of the population suffered from diarrhea and skin sores. As of mid-November, the food supply and water was anticipated to last about four weeks.
The Marshall Islands continued to be free of dryness. Most locations reported more than 2 inches, the minimum weekly amounted to meet most water needs. Wotje received the least rain with 1.40 inches, while Majuro reported an impressive 8.24 inches. All other locations reported 2 to 3 inches for the week.
American Samoa remained free of dryness. Pago Pago received 6.16 inches, while Siufaga Ridge reported 3.74 inches and Toa Ridge, 3.44 inches.
Virgin Islands
The U.S. Virgin Islands remained free of dryness. CoCoRaHS stations reported from 0.25 to 1.22 inches across the islands for the week, after receiving ample rain from a tropical wave the previous week.
Precipitation at St. Thomas’ Cyril E. King AP was 0.15 inches for the week, which was significantly below normal. The CoCoRaHS stations at Charlotte Amalie 5.1 E and Anna's Retreat 2.5 ESE reported 0.79 and 1.22, respectively. The Charlotte Amalie West 4.2 WNW station reported 0.25 inches. The SPI values at 1, 3, 6, 9, and 12 months for the King Airport were 0.82, 0.26, 0.04, -0.29 and -0.14, respectively.
St. John’s Windswept Beach CoCoRaHS station reported 1.16 inches, while 0.83 inches fell at the CoCoRaHS station at Cruz Bay 0.8 NE, and 1.02 inches was reported at the CoCoRaHS station at Cruz Bay 1.6 E. The SPI values for 1, 3, 6, 9, and 12 months for Windswept Beach were 0.56, 0.23, 0.02, -0.44, and -0.04, respectively.
No rain fell at St. Croix’s Henry Rohlsen AP for the week. The CoCoRaHS station at Christiansted 1.8 ESE reported 0.90 inches, while Frederiksted 2.3 N reported 0.31 inches. The SPI values for 1, 3, 6, 9, and 12 months for Henry Rohlsen AP were -0.27, -.028, -0.35, -0.43 and -0.59, respectively.
Looking Ahead
The jet stream will continue to be active during the next couple weeks, sending a parade of Pacific weather systems into the CONUS. For November 25 to December 1, precipitation will fall across the Pacific Northwest, where the coastal mountains may receive over an inch of precipitation, and widespread precipitation is forecast to fall from the southern Plains to East Coast. Amounts may exceed 3 inches from southeast Texas to the southern Appalachians and parts of New England, with an inch or more surrounding these core areas from Texas to Kansas, from the Gulf Coast to Great Lakes, and from the Florida panhandle to the Northeast. A fourth of an inch or less is forecasted to fall across most of the West, from the northern Plains to Upper Mississippi Valley, and over much of Florida. The forecast models predict above-normal temperatures east of the Rockies with near to below-normal temperatures across the West. The outlook for December 2-8 is mostly dry. Odds favor below-normal precipitation across most of the CONUS, with only the Rio Grande Valley and eastern two-thirds of Alaska having odds favoring wetter-than-normal conditions. Odds favor warmer-than-normal temperatures across the West, central to northern Plains, Great Lakes, and eastern Alaska, with below-normal temperatures likely across the southern Plains, Southeast, Mid-Atlantic, and western Alaska.
Author(s):
Richard Heim, NOAA/NCEI
Denise Gutzmer, National Drought Mitigation Center
Dryness Categories
D0 Abnormally Dry—used for areas showing dryness but not yet in drought, or for areas recovering from drought.
Drought Intensity Categories
D1 Moderate Drought
D2 Severe Drought
D3 Extreme Drought
D4 Exceptional Drought
Drought or Dryness Types
S Short-Term, typically less than 6 months (e.g. agricultural, grasslands)
L Long-Term, typically greater than 6 months (e.g. hydrologic, ecologic)
Source: National Drought Mitigation Center