


IMPORTANT NOTE: The employment data for the month of May 2021 is taken from the survey week including May 12. Data for the month of June is scheduled for release on July 16, 2021.
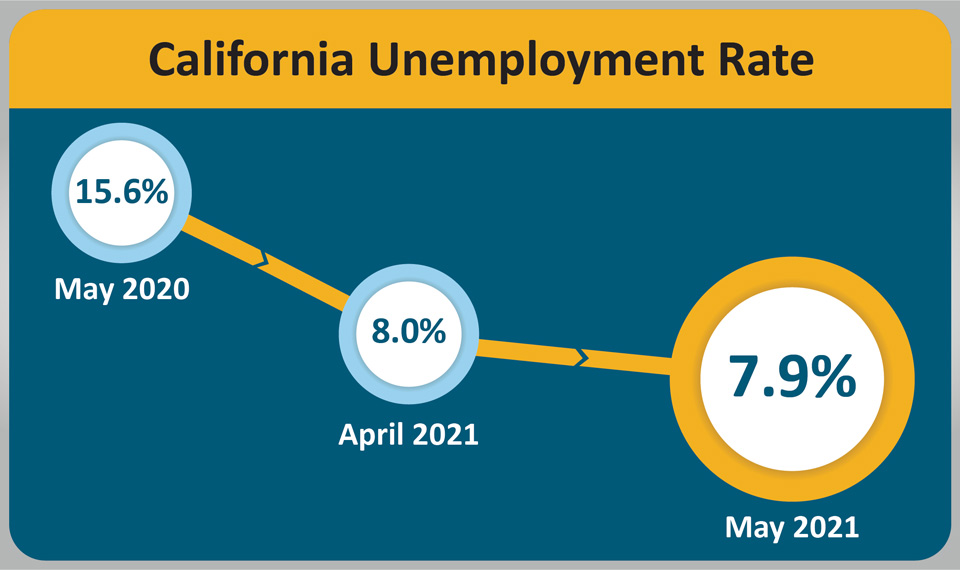
June 18, 2021 - SACRAMENTO – California’s unemployment rate fell to 7.9% in May as the state’s employers gained 104,500 non-farm payroll jobs1, according to data released today by the California Employment Development Department (EDD) from two surveys. This comes after April’s upwards-revised (+200 jobs) month-over gain of 102,000 jobs and a downwards-revised (-59,400) unemployment month-over change of -62,600.

California’s Labor Market, by the Numbers...
- May’s unemployment rate2 is nearly half of the 16% peak rate in April 2020, but is still 3.6% higher than the pre-pandemic unemployment rate of 4.3% in February 2020.
- From February 2021 through May 2021, California added 495,000 total non-farm payroll jobs, marking the state’s fourth consecutive month of gains of more than 100,000 jobs.
- Of the 2,714,800 jobs lost in March and April 2020 due to the COVID-19 pandemic, California has now regained 1,406,800 (51.8%), with a third of those jobs (468,000) coming from the hard-hit Leisure & Hospitality industry.
- Nine of California’s 11 industry sectors gained jobs in May. Leisure & Hospitality (+62,300) continued to have the state’s largest month-over increase thanks to large gains in Accommodations and Food Services & Drinking Places, as well as in Arts, Entertainment, and Recreation. Information’s large job increase (+11,200) was in large part due to gains in Motion Picture and Sound Recording industries.
- Construction (-1,600) suffered the largest month-over job reduction due to losses in Non-Residential Building Construction and Building Foundation & Exterior Contractors.
1. The nonfarm payroll job numbers come from a federal survey of 80,000 California businesses.
2. The unemployment rate comes from a separate federal survey of 5,100 California households.
Data Trends about Jobs in the Economy
Total Nonfarm Payroll Jobs
This comes from a monthly survey of approximately 80,000 California businesses that estimates jobs in the economy – seasonally adjusted.
- Month-over – Total nonfarm jobs in California’s 11 major industries totaled 16,352,900 in May – a net gain of 104,500 jobs from April 2021. This followed an upward revision of 200 jobs for a revised month-over gain of 16,248,400 jobs in April.
- Year-over – Total nonfarm jobs increased by 1,220,200 (an 8.1 percent increase) from May 2020 to May 2021 compared to the U.S. annual gain of 11,900,000 jobs (an 8.9 percent increase).

Total Farm jobs – The number of jobs in the agriculture industry decreased by 4,000 from April 2021 to 409,900 jobs in May. The agricultural industry had 5,100 fewer farm jobs in May 2021 than it did the May prior.
Data Trends about Workers in the Economy
Employment and Unemployment in California
This information is based on a monthly federal survey of 5,100 California households which focuses on workers in the economy.
- Employed – The number of Californians employed in May was 17,418,000, an increase of 39,500 jobs from April’s total of 17,378,500 and up 1,888,700 from the employment total in May of last year.
- Unemployed – The number of unemployed Californians was 1,489,600 in May, a decrease of 27,100 over the month and down 1,373,600 in comparison to May of last year.

Unemployment Insurance Claims (Not Seasonally Adjusted)
The following data is from a sample week that includes the 19th of each month: In related data that figures into the state’s unemployment rate, there were 569,512 people certifying for Unemployment Insurance benefits during the May 2021 sample week. That compares to 579,498 people in April and 2,154,692 people in May 2020. Concurrently, 71,259 initial claims were processed in the May 2021 sample week, which was a month-over decrease of 7,381 claims from April and a year-over decrease of 132,329 claims from May 2020.

| COUNTY | LABOR FORCE | EMPLOYMENT | UNEMPLOYMENT | RATE |
|---|---|---|---|---|
| STATE TOTAL | 18,949,700 | 17,523,600 | 1,426,100 | 7.5% |
| ALAMEDA | 799,500 | 751,700 | 47,800 | 6.0% |
| ALPINE | 460 | 420 | 40 | 8.8% |
| AMADOR | 14,460 | 13,560 | 910 | 6.3% |
| BUTTE | 92,000 | 85,900 | 6,100 | 6.6% |
| CALAVERAS | 21,370 | 20,210 | 1,160 | 5.4% |
| COLUSA | 11,040 | 9,800 | 1,240 | 11.2% |
| CONTRA COSTA | 533,000 | 499,500 | 33,500 | 6.3% |
| DEL NORTE | 9,250 | 8,560 | 690 | 7.4% |
| EL DORADO | 90,000 | 85,000 | 5,000 | 5.6% |
| FRESNO | 445,700 | 406,500 | 39,200 | 8.8% |
| GLENN | 12,960 | 12,140 | 820 | 6.3% |
| HUMBOLDT | 59,800 | 56,300 | 3,500 | 5.8% |
| IMPERIAL | 66,700 | 56,100 | 10,600 | 15.9% |
| INYO | 8,190 | 7,740 | 450 | 5.5% |
| KERN | 378,900 | 340,800 | 38,200 | 10.1% |
| KINGS | 56,300 | 51,200 | 5,200 | 9.2% |
| LAKE | 29,380 | 27,340 | 2,040 | 6.9% |
| LASSEN | 9,620 | 9,110 | 510 | 5.3% |
| LOS ANGELES | 5,120,300 | 4,600,900 | 519,500 | 10.1% |
| MADERA | 63,300 | 58,000 | 5,300 | 8.4% |
| MARIN | 130,200 | 124,600 | 5,600 | 4.3% |
| MARIPOSA | 7,210 | 6,690 | 510 | 7.1% |
| MENDOCINO | 36,360 | 34,210 | 2,150 | 5.9% |
| MERCED | 116,800 | 105,200 | 11,600 | 9.9% |
| MODOC | 3,350 | 3,150 | 200 | 5.9% |
| MONO | 7,270 | 6,750 | 530 | 7.2% |
| MONTEREY | 221,600 | 205,400 | 16,200 | 7.3% |
| NAPA | 71,400 | 67,400 | 4,000 | 5.5% |
| NEVADA | 45,650 | 43,170 | 2,480 | 5.4% |
| ORANGE | 1,555,000 | 1,463,800 | 91,200 | 5.9% |
| PLACER | 184,000 | 174,900 | 9,100 | 4.9% |
| PLUMAS | 7,830 | 7,240 | 590 | 7.5% |
| RIVERSIDE | 1,106,700 | 1,027,200 | 79,500 | 7.2% |
| SACRAMENTO | 703,000 | 655,100 | 47,900 | 6.8% |
| SAN BENITO | 31,200 | 29,000 | 2,200 | 7.1% |
| SAN BERNARDINO | 971,700 | 900,600 | 71,100 | 7.3% |
| SAN DIEGO | 1,519,300 | 1,422,200 | 97,200 | 6.4% |
| SAN FRANCISCO | 544,000 | 516,300 | 27,700 | 5.1% |
| SAN JOAQUIN | 334,300 | 306,400 | 27,900 | 8.3% |
| SAN LUIS OBISPO | 129,400 | 122,700 | 6,700 | 5.2% |
| SAN MATEO | 426,700 | 407,100 | 19,600 | 4.6% |
| SANTA BARBARA | 219,600 | 207,700 | 11,900 | 5.4% |
| SANTA CLARA | 1,010,300 | 963,100 | 47,200 | 4.7% |
| SANTA CRUZ | 132,000 | 123,000 | 9,000 | 6.8% |
| SHASTA | 73,200 | 68,600 | 4,700 | 6.4% |
| SIERRA | 1,330 | 1,270 | 60 | 4.8% |
| SISKIYOU | 16,860 | 15,670 | 1,190 | 7.0% |
| SOLANO | 199,800 | 185,500 | 14,300 | 7.2% |
| SONOMA | 242,500 | 229,700 | 12,800 | 5.3% |
| STANISLAUS | 240,300 | 221,000 | 19,300 | 8.0% |
| SUTTER | 45,500 | 41,600 | 3,900 | 8.6% |
| TEHAMA | 25,330 | 23,590 | 1,740 | 6.9% |
| TRINITY | 4,590 | 4,330 | 260 | 5.6% |
| TULARE | 201,200 | 180,600 | 20,600 | 10.2% |
| TUOLUMNE | 19,740 | 18,380 | 1,360 | 6.9% |
| VENTURA | 406,800 | 383,000 | 23,800 | 5.8% |
| YOLO | 105,700 | 99,800 | 5,900 | 5.6% |
| YUBA | 29,700 | 27,200 | 2,500 | 8.3% |
Source: CA. EDD
