

October 15, 2021 - By Emily Becker - Our second-year La Niña has materialized, as indicated by the ocean and atmosphere in the tropical Pacific. There’s an 87% chance of La Niña this winter, the season when North American weather and climate are most affected by ENSO (El Niño/Southern Oscillation, the entire El Niño/La Niña system).
The winning numbers
The first step on our “Is it La Niña?” decision tree asks “is the monthly Niño-3.4 Index equal to or less than -0.5°C?” The Niño-3.4 Index, our primary metric for ENSO, is the anomaly in sea surface temperature in the central equatorial Pacific (anomaly = the difference from the long-term average; “average” is 1991–2020 nowadays).
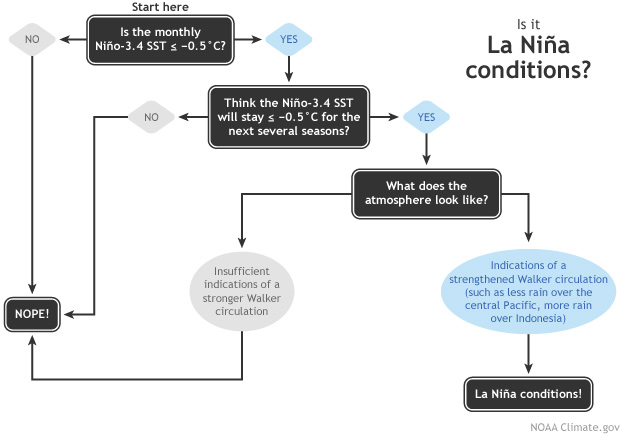
Flowchart showing decision process for determining La Niña conditions. Figure by Fiona Martin, adapted by Climate.gov.
The September Niño-3.4 Index was -0.5°C, according to ERSSTv5, our primary dataset. So it’s on to the next box on the decision tree! Do we think that anomaly will remain cooler than the La Niña threshold? Again, yes! Nearly all computer models are currently predicting that the cooler-than-average conditions will remain through the winter. Another source of confidence for the Niño-3.4 Index to remain cooler than the La Niña threshold is the large amount of cooler-than-average water beneath the surface of the equatorial Pacific. This subsurface water provides a source for the surface, and it has been intensifying in recent weeks.
Water temperatures in the top 700 meters (2,300 feet) of the tropical Pacific Ocean compared to the 1991-2020 average in late summer 2021. NOAA Climate.gov animation, based on data from NOAA's Climate Prediction Center.
The final requirement to get to La Niña conditions is that the atmosphere is showing signs of responding to that cooler-than-average surface water. Over the past month, the low-level winds near the equator, which usually blow from east to west (the trade winds), were stronger than average, as were the west-to-east winds high up in the atmosphere.
These signs, along with more rain than average over Indonesia and less in the central Pacific, tell us that the Walker circulation is juiced up. A stronger Walker circulation is the expected atmospheric response to La Niña. The Walker circulation is driven by the difference between the very warm ocean surface in the far western Pacific and the relatively cool eastern Pacific; during La Niña, this difference is enhanced, leading to a stronger Walker circulation.
Follow the blue brick road, and we get to La Niña!
Buy one, get one free
La Niña has probably earned silver-elite, frequent-flier status here, as this is the fourth time we’ve written a “La Niña is here” post on the ENSO Blog! (Earlier posts are September 2020, November 2017, and November 2016.) That’s four of the seven-and-a-half years we’ve been standing on this digital street corner yelling about ENSO.
Overall, La Niña is not more common that El Niño—in the historical record dating back to 1950, there have been 25 El Niños and 24 La Niñas (counting this year). However, La Niña often occurs in consecutive winters, while El Niño rarely does. The reason for this is difficult to explain in brief, but researchers think it’s partly due to differences in atmosphere-ocean coupling between La Niña and El Niño.
As you can see int he map below, the center of the ocean surface temperature anomaly tends to be a bit weaker and a bit farther west during La Niña than El Niño. The difference in strength and location means the trade winds response is not exactly opposite in La Niña and El Niño—unsurprisingly, the response tends to be weaker and centered farther west during La Niña than El Niño.
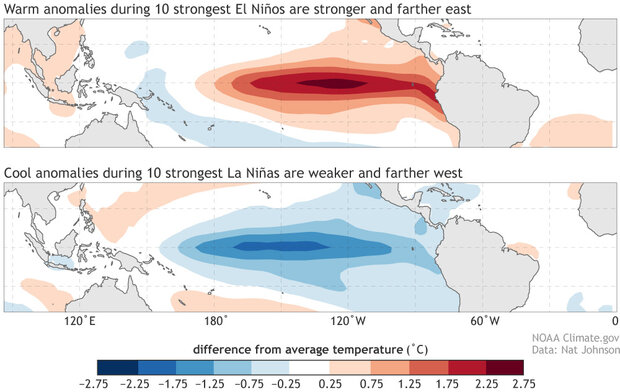
Average November – January sea surface temperature anomalies (°C) for the top 10 strongest (top) El Niño and (bottom) La Niña events since 1950 based on the November – January Niño3.4 index. Anomalies are calculated with respect to 30-year base periods updated every 5 years (see here for a description). NOAA Climate.gov figure with ERSSTv5 data obtained from the NOAA Physical Sciences Laboratory.
El Niño events end when the equatorial temperature anomalies are dispersed away from the equator, and this process tends to be less robust in La Niña. The less-clean end to La Niña means that it’s not hard for the system to tip back into La Niña the next year. For more on how this works, check out Nat’s excellent post on double-dip La Niña.
Holiday sale
We’ve already seen one likely effect of La Niña this year—a more active Atlantic hurricane season, with nearly twice as many storms as average so far this year. But the most substantial La Niña effect on North American rain, snow, and temperature happens during winter. In summary, La Niña winters tend to be drier and warmer across the southern third of the U.S., and cooler in the northern U.S. and Canada. The Pacific Northwest, the Tennessee/Ohio Valleys, and parts of the Midwest tend to see more rain and snow than average.
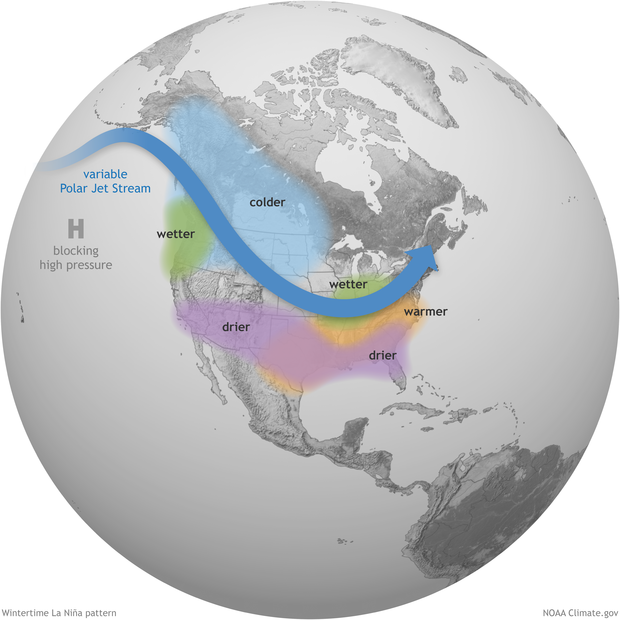
La Niña intensifies the average atmospheric circulation—surface and high-altitude winds, rainfall, pressure patterns—in the tropical Pacific. Over the contiguous United States, the average location of the jet stream shifts northward. The southern tier of the country is often drier and warmer than average. NOAA Climate.gov illustration.
For more information, check out these posts on how La Niña affects the Jet Stream, drought during second-year La Niña, snow during La Niña winters, and La Niña’s role in South American climate. NOAA’s Climate Prediction Center’s winter weather outlook will be released soon, and you can find the current seasonal forecasts here.
And, of course, we’ll be here at the ENSO Blog to keep you updated as La Niña 2021–22 progresses. Till next time!
A blog about monitoring and forecasting El Niño, La Niña, and their impacts.
Disclaimer:
The ENSO blog is written, edited, and moderated by Michelle L’Heureux (NOAA Climate Prediction Center), Emily Becker (University of Miami/CIMAS), Nat Johnson (NOAA Geophysical Fluid Dynamics Laboratory), and Tom DiLiberto and Rebecca Lindsey (contractors to NOAA Climate Program Office), with periodic guest contributors.
Ideas and explanations found in these posts should be attributed to the ENSO blog team, and not to NOAA (the agency) itself. These are blog posts, not official agency communications; if you quote from these posts or from the comments section, you should attribute the quoted material to the blogger or commenter, not to NOAA, CPC, or Climate.gov.
Source: ENSO blog team