

March 2022 La Niña update: three-bean salad
March 13, 2022 - By Michelle L’Heureux - Three-bean salads are a blend of sweet-sour tastiness, implying all good things come in threes. Well, depending on your opinion of La Niña, maybe not all good things, as La Niña—the cool phase of the El Niño-Southern Oscillation climate pattern—reasserted itself in the tropical Pacific this past month with some of the strongest atmosphere-ocean coupling of our double-dip La Niñas so far (winters of 2020-21 and 2021-22). La Niña is now favored to continue into the Northern Hemisphere summer 2022, with nearly equal chances of ENSO-neutral or La Niña thereafter. Is a La Niña three-peat in the offing?
Three-dimensional
Back up, La Niña strengthened in February? It did, despite the fact that sea surface temperatures in the key monitoring region of the tropical Pacific, the Niño-3.4 region, appear to have bottomed out in December, with a monthly value of -1.1°C (ERSSTv5 data set). Since then, the monthly values have warmed slightly, though February 2022 remained chilly at -0.9 °C. However, the February average smoothed out some notable variability: the weekly average Niño-3.4 index was -0.6 °C at the beginning of February and then decreased to -1.1 °C in the past week. Quite a dive!
Sea surface temperatures in the tropical Pacific Ocean from mid-January through February 2022 compared to the long-term average. East of the International Dateline (180˚), waters remained cooler than average, a sign of La Niña. Graphic by Climate.gov, based on data from NOAA’s Environmental Visualization Lab. Description of historical baseline period here.
Confused by all the numbers for presumably the same Niño-3.4 sea surface temperature index? Don’t be-- averages for shorter time spans can fluctuate around a lot more than longer averaging periods. This is the difference between weather and climate. Day-to-day or week-to-week weather can change a lot relative to monthly and longer seasonal climate averages, which do not vary as much. Even as the weekly and monthly values have jumped around, the Oceanic Niño Index (ONI), NOAA’s official measure of ENSO, has remained constant at -1.0°C for the third, overlapping season in a row.
One of the major challenges in ENSO prediction is trying to untangle meaningful seasonal swings in the tropical climate from the shorter-term noise of tropical weather. In February, along with cooling off of sea surface temperatures, we saw a stronger Pacific Walker circulation: a strengthening of trade winds along the surface of the equator (blowing from east-to-west), stronger winds in the upper tropical atmosphere (that blow from west to east), significant drying over the Date Line, and increased rainfall anomalies over the Maritime Continent. All of these features are consistent with a healthy La Niña.
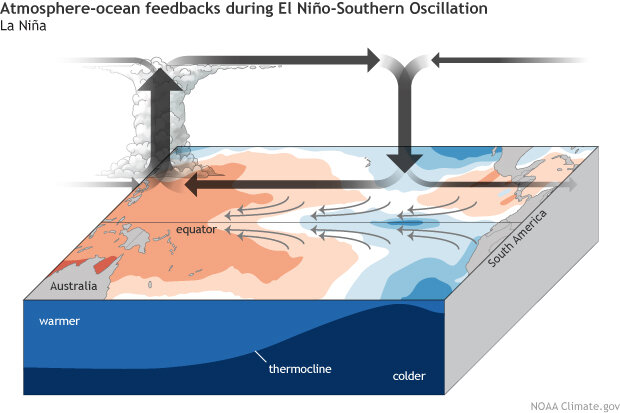
La Niña feedbacks between the ocean and atmosphere. Climate.gov schematic by Emily Eng and inspired by NOAA PMEL.
In fact, by some of our atmospheric measures—the Equatorial Southern Oscillation Index and Central Pacific Outgoing Longwave Radiation index (a measure of equatorial rainfall)—we saw some of the largest monthly values dating back to the start of the first La Niña event in the autumn of 2020! The Pacific Walker circulation was clearly juiced up in the past month and is probably why we saw weekly Niño-3.4 sea surface temperatures take a tumble.
With that said, one month doesn’t make an entire season, and it may have been a short-term swerve on the road to the dissipation of La Niña, as it typically does, through the spring and summer. It’s enough to have at least slowed down La Niña’s exit from the global climate stage, but does it portend more meaningful change going forward? We’ll get back to that later.
Three-legged race
What does the continuation of La Niña mean for impacts during the March-May season over the contiguous United States? As regular blog readers know, the two biggest drivers of seasonal climate outlooks are ENSO and climate trends. The images below show the average March-May temperature and precipitation patterns we’d expect based on the combination of historical La Niña patterns and recent (10-15 year) climate trends.
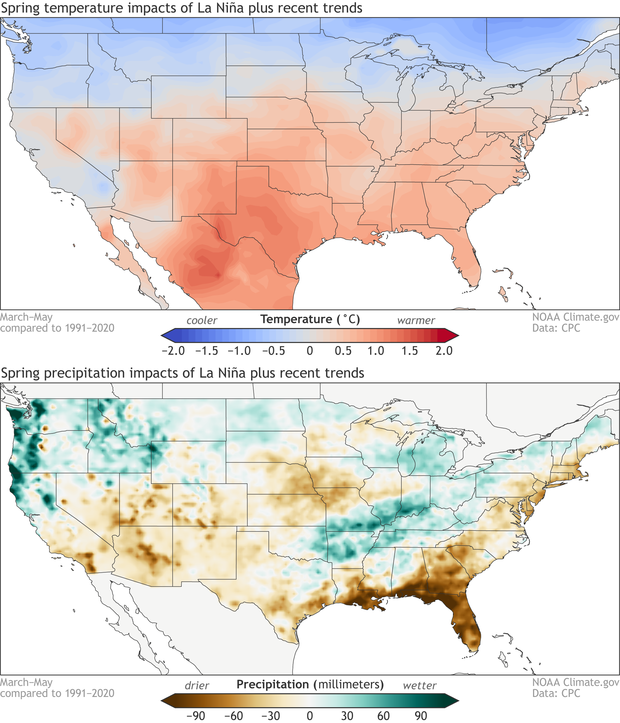
March-May average temperature (top) and precipitation (bottom) compared to the long-term average for the combination of historical La Niña events and climate trends. Data is based on the CPC ENSO composites and modified by Climate.gov.
As one might expect, NOAA CPC’s official seasonal outlooks for March-May 2022 resemble the patterns above with some exceptions. In general, above-average temperatures are favored over a large part of the contiguous U.S., with the exception of the northwestern U.S., where below-average temperatures are more likely. Above-median precipitation is expected over the northwestern U.S. and the Ohio and Tennessee valleys. Below-median precipitation is favored over most of the southern U.S., extending northward into Utah, Colorado, and parts of the western Great Plains (footnote #1).
In addition to these potential temperature and precipitation anomalies, it is also worth checking out a previous article by Mike Tippett and Chiara Lepore on ENSO and Tornadoes. During La Niña, springtime severe weather can be more active in parts of the southern/southeastern United States (though not a guarantee as John Allen explained to us after the 2020-21 La Niña).
Three’s a crowd
Despite a few forecast models suggesting otherwise, below-average sea surface temperature patterns are likely to weaken across the tropical Pacific as we go through the spring, but it’s still an open question how much they will weaken. Will they weaken enough to eventually return to ENSO-neutral (near average conditions across the tropical Pacific)? And when would that happen?
This month the crystal ball became blurrier, with a 54% chance that La Niña persists into June-August 2022. And, after that, it’s pretty much a split between ENSO-neutral and La Niña through the fall, with neither outcome exceeding a 50% probability (and El Niño still has a 10-15% chance!). Thus, reading between the lines, odds for a La Niña three-peat have gone up (Emily first blogged about this possibility in November 2021), but nowhere near certainty. Keep in mind, the accuracy of ENSO forecasts made this time of year are, well…not so great.
Also, La Niña three-peats (triple dips?) are very rare—only two exist in our more reliable historical record going back to 1950 and both occurred after major El Niño events, which our current event did not. The time evolution of the Niño-3.4 index for the two La Niña three-peats is featured in the darker blue lines in the image below. It is also interesting that out of the eight double-dip La Niñas in our historical record, three ended up evolving into an El Niño for the third winter (red lines) and the remaining three ended up on the cooler side, close to La Niña thresholds, but were ultimately classified as ENSO-neutral winters.
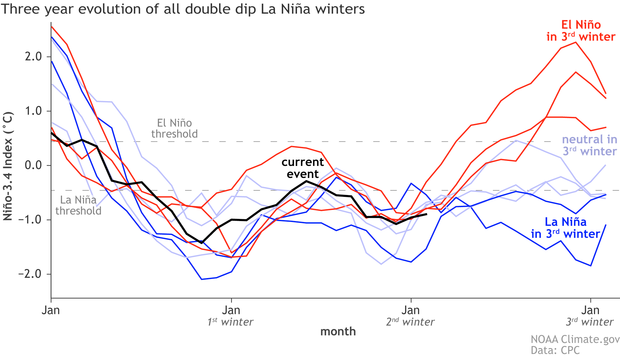
Three-year history of sea surface temperatures in the Niño-3.4 region of the tropical Pacific for 8 previous double-dip La Niña events. The color of the line indicates the state of ENSO for the third winter (red: El Niño, darker blue: La Niña, lighter blue: neutral). The black line shows the current event. Monthly Niño-3.4 index is from CPC using ERSSTv5. Time series comparison was created by Michelle L’Heureux, and modified by Climate.gov.
To get to a third consecutive La Niña winter we would need to see ongoing, enhanced easterly trade winds and, also, the replenishment of below-average temperature “fuel” in the subsurface equatorial Pacific Ocean. In February, at least, we saw some trends in this direction.
So, is this two steps forward, one step back? Or three steps forward? Stay tuned next month when Emily returns from vacation. If we’re lucky maybe she’ll include some pretty tropical photos. Maybe three of them.
A blog about monitoring and forecasting El Niño, La Niña, and their impacts.
Disclaimer:
The ENSO blog is written, edited, and moderated by Michelle L’Heureux (NOAA Climate Prediction Center), Emily Becker (University of Miami/CIMAS), Nat Johnson (NOAA Geophysical Fluid Dynamics Laboratory), and Tom DiLiberto and Rebecca Lindsey (contractors to NOAA Climate Program Office), with periodic guest contributors.
Ideas and explanations found in these posts should be attributed to the ENSO blog team, and not to NOAA (the agency) itself. These are blog posts, not official agency communications; if you quote from these posts or from the comments section, you should attribute the quoted material to the blogger or commenter, not to NOAA, CPC, or Climate.gov.
Source: ENSO blog team