

November 2022 La Niña update: Let’s get some exercise
November 12, 2022 - By Emily Becker - It’s very likely that La Niña will last through the winter (December–February), with a transition to ENSO-neutral (neither La Niña nor El Niño) expected during February–April. Specifically, there’s a 76% chance of La Niña through the winter and a 57% chance of neutral in the February–April period.
High reps
Acronym time! ENSO, the El Niño/Southern Oscillation (the entire El Niño and La Niña system), modifies global weather and climate in somewhat predictable ways. Since ENSO itself can be predicted several months in advance, it gives us an early picture of potential global rain, snow, and temperature patterns, among other climate effects. Check out my September post for a round-up of La Niña’s impacts.
In the U.S., our primary measurement for ENSO is the Oceanic Niño Index (ONI), the three-month average of the sea surface temperature in the Niño-3.4 region in the tropical Pacific. Specifically, it’s the anomaly, the difference from the long-term average sea surface temperature, where long-term is now 1991–2020. When the ONI is more than half a degree Celsius cooler than average, we’re in La Niña territory. It needs to stay there for at least 5 consecutive 3-month-average periods to qualify as a La Niña, but that has not been a heavy lift lately!
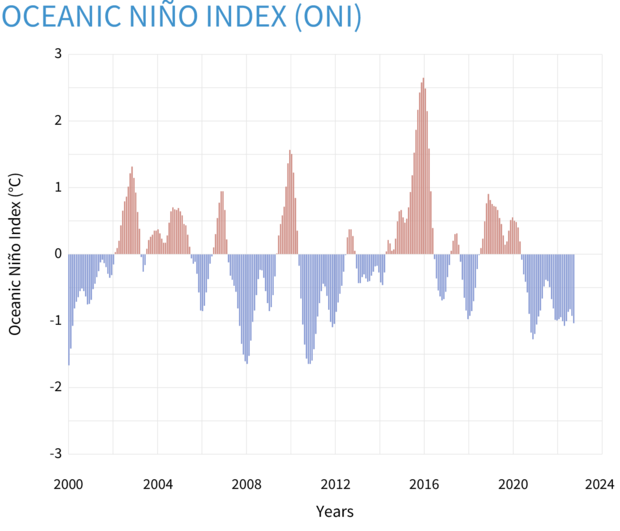
Seasonal (3-month) sea surface temperatures in the central tropical Pacific Ocean compared to the 1981-2010 average. Warming or cooling of at least 0.5˚Celsius above or below average near the International Dateline is one of the criteria used to monitor the El Niño-La Niña climate pattern. NOAA Climate.gov image, based on data from the Climate Prediction Center.
Except for a short break in the summer of 2021, the ONI has been cooler than the La Niña threshold since summer 2020. Heading into our third La Niña winter in a row, we find ourselves in a situation we’ve only recorded twice before, 1973–76 and 1998–2001. Both of those previous triple-deckers followed strong El Niño years, while this one follows the warmish-neutral winter of 2019–2020. The physics behind why we ended up with three La Niña winters in a row this time is going to be an active research topic for climate scientists!
Crunches
There’s close to a 100% chance that La Niña will remain through the October–December period.
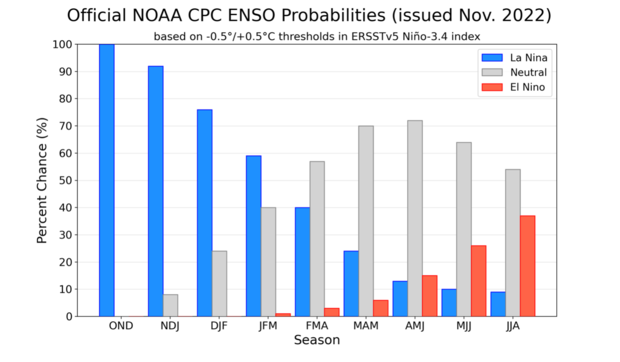
NOAA Climate Prediction Center forecast for each of the three possible ENSO categories for the next 8 overlapping 3-month seasons. Blue bars show the chances of La Niña, gray bars the chances for neutral, and red bars the chances for El Niño. Graph by Michelle L'Heureux.
Why are we so certain? To start with, there’s that Niño-3.4 sea surface temperature anomaly, which was -1.0 °C in October. The required La Niña ocean-atmosphere feedback, featuring a beefed-up Walker circulation (stronger trade winds, more rain/clouds than average over Indonesia, less over the central Pacific), was in full force for most of October. Also, there is a substantial amount of cooler-than-average water under the surface of the tropical Pacific.
Water temperatures in the top 700 meters (2,300 feet) of the tropical Pacific Ocean compared to the 1991–2020 average in September–October 2022. NOAA Climate.gov animation, based on data from NOAA's Climate Prediction Center.
This subsurface water will continue to supply the surface with a source of cooler water for the next couple of months at least. One interesting thing about the animation above is that the blob of cooler water appears nearly stationary, instead of traveling west-to-east like an upwelling Kelvin wave. This provides yet more evidence that the La Niña ocean-atmosphere coupling is well-established.
Cardio
Over the last week or so, though, the trade winds have weakened. This could mean that we’re near the peak of this La Niña, in terms of the ONI. Sea surface temperature anomalies in the Niño-3.4 region often reach their maximum or minimum in the October–December period, so we’d be right on schedule. Of course, La Niña, and its effect on rain, snow, and temperature is very likely to continue through the winter, regardless exactly when the minimum Niño-3.4 anomaly occurs.
Where are we headed? The current forecast from the North American Multi-Model Ensemble (NMME), a set of state-of-the-art computer climate models, is a major factor in the forecaster consensus. At this point, the NMME is predicting a decay of the Niño-3.4 anomalies into the spring.
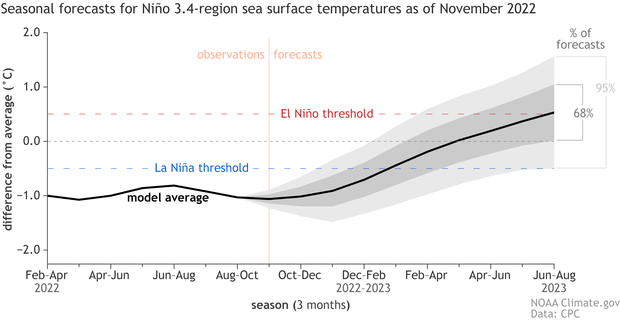
Climate model forecasts for the Niño-3.4 temperature anomalies in 2022–23. Average dynamical model data (black line) from the North American Multi-Model Ensemble (NMME): darker gray envelope shows the range of 68% of all model forecasts; lighter gray shows the range of 95% of all model forecasts. NOAA Climate.gov image from University of Miami data.
The exact timing on when that transition occurs is a bit uncertain. At this time, the official forecast is predicting a return to neutral conditions during February–April. What about next summer? Can we get a peek at that yet? The longest lead we currently predict is 9 months into the future, June–August 2023. If you look back at the forecaster probabilities I showed earlier, the chance of El Niño is higher than the chance of La Niña for next summer. Neutral is still by far the most likely outcome—this is not to be interpreted as a forecast for El Niño! The last time we had a greater chance for El Niño than La Niña at these longest leads was December 2019. (Actually, it started with last month’s forecast—I didn’t notice then!)
We’ll keep an eye on the long-term forecast, but for now, the La Niña marathon continues. Stay hydrated and see you next month!
A blog about monitoring and forecasting El Niño, La Niña, and their impacts.
Disclaimer:
The ENSO blog is written, edited, and moderated by Michelle L’Heureux (NOAA Climate Prediction Center), Emily Becker (University of Miami/CIMAS), Nat Johnson (NOAA Geophysical Fluid Dynamics Laboratory), and Tom DiLiberto and Rebecca Lindsey (contractors to NOAA Climate Program Office), with periodic guest contributors.
Ideas and explanations found in these posts should be attributed to the ENSO blog team, and not to NOAA (the agency) itself. These are blog posts, not official agency communications; if you quote from these posts or from the comments section, you should attribute the quoted material to the blogger or commenter, not to NOAA, CPC, or Climate.gov.
Source: ENSO blog team