


California and National Drought Summary for August 6, 2024
Summary
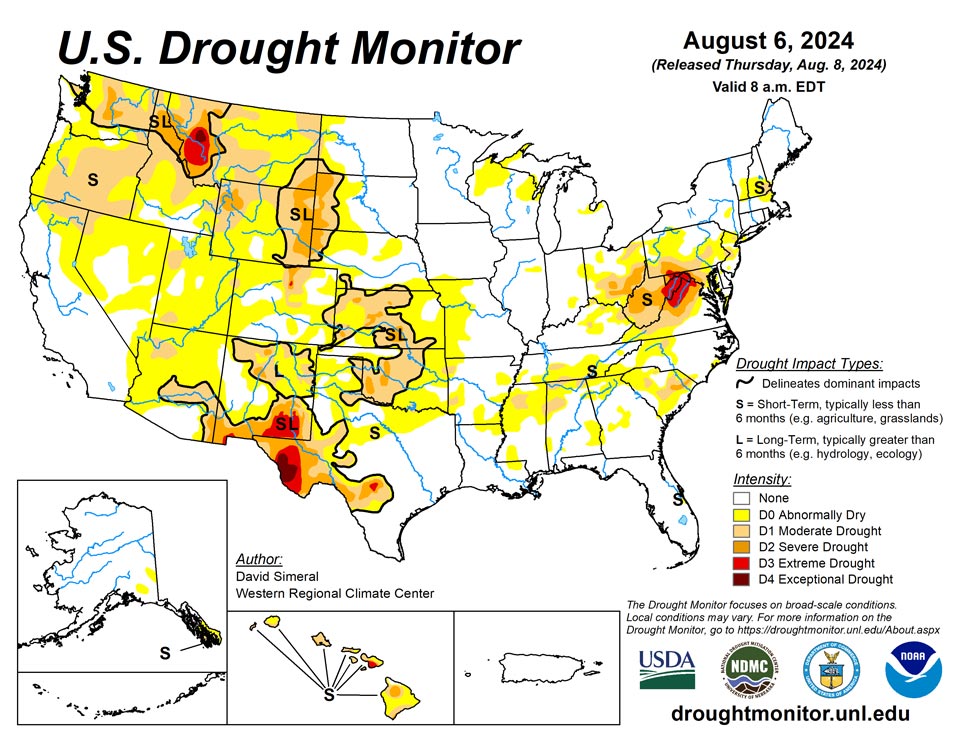
August 8, 2024 - This U.S. Drought Monitor (USDM) week saw widespread improvement in drought-related conditions on the map across areas of the Southeast, Mid-Atlantic, and in areas of the Midwest. Elsewhere, hot and dry conditions prevailed in areas of the West, Plains, and the South during the past 14-to-30-day period, leading to the expansion and intensification of drought on this week’s map with particular concern over the developing flash drought situation in areas of the Plains states. In the Southeast, Hurricane Debby (Category 1) made landfall Monday morning in Florida’s Big Bend region bringing a powerful storm surge, strong winds, torrential rains, and severe flooding to much of Florida’s Gulf Coast region from southwest Florida to the north-central region. Rainfall accumulations ranged from 2 to 20+ inches across affected areas with the heaviest accumulations logged in the greater Sarasota area. The impacts of Hurricane Debby, which weakened to a tropical storm shortly after making landfall, were also felt across the coastal zones and plains of Georgia and South Carolina with heavy rainfall (up to 15 inches according to radar estimates) and flooding. On the map, some drought-related improvements were made this week in the Carolinas in association with the remnant moisture from Hurricane Debby. However, it is noteworthy that this week’s drought depiction is representative of rainfall that fell until the data cutoff at 8 a.m. ET on Tuesday and additional improvements are expected on next week’s map. Elsewhere, light-to-moderate rainfall accumulations (2 to 4 inches) were observed across areas of the Northeast, Midwest, and in isolated areas of the Northern Plains. Out West, some monsoon-related storm activity was observed in isolated areas of the Four Corners states and Nevada as well as some light shower activity in areas of Idaho and Montana. In terms of reservoir storage in areas of the West, California’s reservoirs continue to be near or above historical averages for the date (August 6) with the state’s two largest reservoirs (Lake Shasta and Lake Oroville) at 111% and 116% of their averages, respectively. In the Southwest, Lake Powell is currently 39% full (64% of typical storage level for the date) and Lake Mead is 33% full (53% of average) with the total Lower Colorado system 44% full as of August 5 (compared to 44% full at the same time last year), according to the U.S. Bureau of Reclamation. In Arizona, the Salt River Project is reporting the Salt River system reservoirs 85% full, the Verde River system 64% full, and the total reservoir system 83% full (compared to 91% full a year ago). In New Mexico, the state’s largest reservoir along the Rio Grande is currently 11% full (25% of average). In the Pacific Northwest, Washington’s Franklin D. Roosevelt Lake is 93% full (121% of average for the date) and Idaho’s American Falls Reservoir on the Snake River is 50% full (84% of average).
Northeast
On this week’s map, some minor changes were made in the region with improvements in isolated areas of Maine, Vermont, New York, New Jersey, Pennsylvania, and Delaware, while minor deterioration in drought-related conditions occurred in West Virginia. For the week, areas of the region observed light-to-moderate precipitation accumulations ranging from 1 to 4+ inches with the heaviest accumulations observed in central and eastern Pennsylvania. Average temperatures for the week were 2 to 8+ degrees F above normal across the region with the greatest departures observed across the New England states as well as New York, New Jersey, and eastern Pennsylvania. According to NOAA’s National Center for Environmental Information (NCEI), the December 2023-June 2024 period (July 2024 data not available) was the warmest (+6.1 degrees F anomaly) on record for the Northeast Climate Region. In terms of precipitation rankings for the contemporaneous period, the region experienced its 3rd wettest (+6.5-inch anomaly) on record.
Southeast
During the past week, moderate to very heavy rainfall accumulations were observed across the region in association with Hurricane Debby and its remnant moisture. The heaviest accumulations (ranging from 10 to 20+ inches) were observed in areas of west-central and north-central Florida, southeastern Georgia, and southeastern South Carolina. The abundant moisture led to removal of areas of Abnormally Dry (D0) in Florida as well as major improvements in drought conditions in Georgia and the Carolinas with continued improvements likely on next week’s map as the storm event is ongoing. Additionally, improvements were made in other areas of the region, including Alabama and Virginia where precipitation has been well above normal during the past 30-day period. In terms of average temperatures for the week, the greatest anomalies (3 to 5+ degrees F) were observed across northern Virginia, while the remainder of the region experienced temperatures that were 1 to 3 degrees F above normal.
South
Across the region, dry conditions prevailed this week as well as above-normal temperatures with the greatest anomalies (+4 to 8 degrees F) observed in the Texas Panhandle and Trans-Pecos regions as well as in areas of southeastern Oklahoma, and southern portions of Louisiana and Mississippi. On the map, deterioration occurred in northern and western portions of Texas, eastern Oklahoma, southern Arkansas, and Mississippi, while near- to above-normal precipitation during the past 30-day period led to widespread improvements across Tennessee. In Oklahoma, the rapidly declining soil moisture and escalating fire danger are heightening concerns about widespread flash drought, according to the Oklahoma Climatological Survey. In Texas, Water for Texas (August 7) is reporting statewide reservoirs currently at 76.7% full with numerous reservoirs in the eastern part of the state in good condition, while many reservoirs in the western half of the state are experiencing below-normal levels. In terms of topsoil conditions across the region, the USDA (week August 4) is reporting the statewide topsoil moisture rated by percent short to very short as follows: Tennessee 29%, Mississippi 39%, Arkansas 47%, Louisiana 22%, Oklahoma 59%, and Texas 67%.
Midwest
On this week’s map, improvements were made on the map across the eastern portion of the region in Indiana, Ohio, and Kentucky in response to rainfall this week (1 to 4 inches) as well as overall improving conditions during the past 30-day period. Rainfall during the past 30 days has been well above normal across central Minnesota, southeastern Iowa, southern and central Wisconsin, Illinois, Indiana, and Kentucky. In terms of topsoil conditions across the Midwest, the USDA (week August 4) is reporting the statewide topsoil moisture rated by percent short to very short as follows: Minnesota 7%, Iowa 13%, Missouri 19%, Wisconsin 6%, Illinois 8%, Michigan 25%, Indiana 21%, Kentucky 17%, and Ohio 45%. For the week, average temperatures were above normal across the region with anomalies ranging from 2 to 8 degrees F above normal with the greatest departures observed in Michigan’s Upper Peninsula.
High Plains
On this week’s map, all states within the High Plains region saw degradations in response to a combination of factors including below-normal precipitation (past 30-60-day period), above-normal temperatures (+4 to 10 degrees F during the past 14 days), high evaporative demand, and intensifying flash drought conditions in recent weeks. Moreover, within the past 30 days, numerous agricultural impacts have been reported by extension agents as well as by local farmers and ranchers to the National Drought Mitigation Center’s (NDMC) Condition Monitoring Observer Reports (CMOR) system. Impact reports include crop stress, critically low soil moisture, water hauling, and reduced forage, with the highest concentration of reports coming in from western portions of the Dakotas, western Nebraska, and eastern portions of Montana and Wyoming. According to the USDA (August 4), statewide topsoil moisture rated by percent short to very short is as follows: Kansas 55%, Nebraska 49%, South Dakota 32%, North Dakota 25%, Montana 68%, Wyoming 83%, and Colorado 58%.
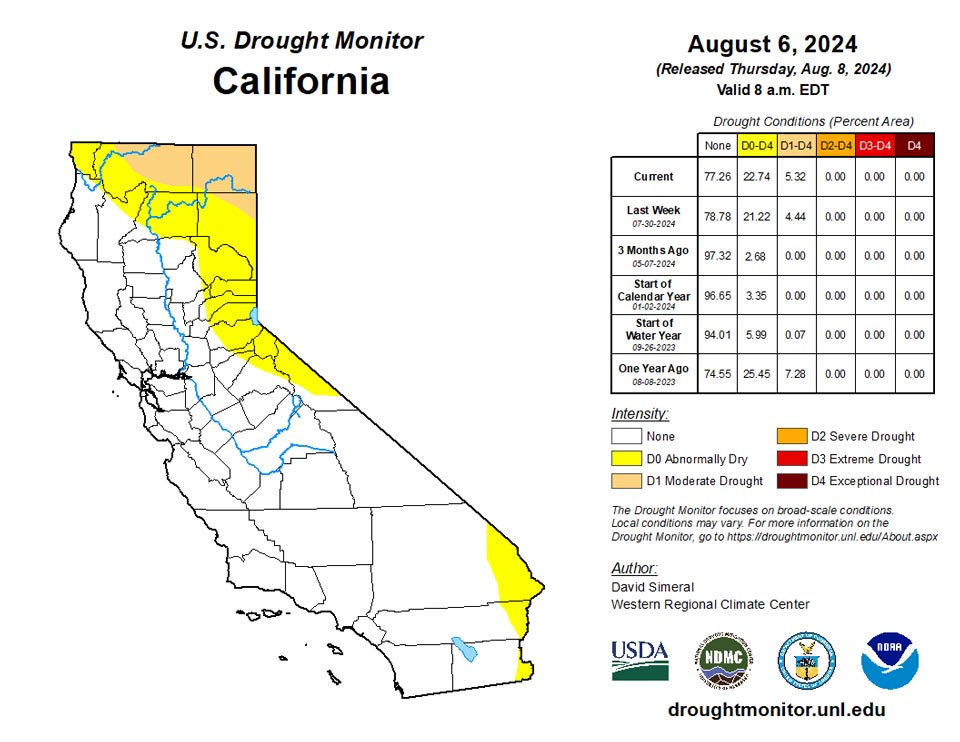
West
Out West, the overall hot and dry pattern observed during the past 30-60-day period continued to desiccate many parts of the region leading to the addition of numerous areas of Abnormally Dry (D0) as well as expansion of areas of drought (primarily Moderate Drought D1) in the Pacific Northwest, California, Intermountain West, and the Southwest. Furthermore, the hot and dry weather continued to exacerbate fire conditions with numerous large fires burning across the region, including California’s Park Fire (northeast of Chico, CA), which has burned ~414,890 acres and was only 34% contained, according to the U.S. Forest Service on August 7. In terms of wildland fire potential for the remainder of August 2024, the National Interagency Fire Center’s Significant Wildland Fire Potential Outlook is forecasting above-normal fire potential across areas of Washington, Idaho, Montana, California, Nevada, and Utah. Looking at statewide reservoir storage (August 1), reservoir storage (as compared to the 1991-2020 median) is above normal in Arizona, Idaho, Nevada, Oregon, and Utah with below-normal levels in Colorado, Montana, New Mexico, Washington, and Wyoming, according to the National Resources Conservation Service.
Caribbean
In Puerto Rico, no changes were made on this week’s map.
Two tropical waves moved through the region during the past drought week (Wed, Jul 31 – Tue, Aug 6, 2024). Moisture trailing from the first tropical wave brought increased thunderstorm activity to the region, with frequent lightning, gusty winds, heavy rain, and areas of flooding. This system would later intensify into Tropical Storm (and briefly Hurricane) Debby before making landfall in the Big Bend region of northern Florida. The second tropical wave was accompanied by an increase in tropical shower activity across the northeast Caribbean during the second half of the drought week. Saharan dust contributed to the hazy skies around the region during the latter portion of the week.
Generous rains fell across most of the U.S. Virgin Islands this past drought week, ranging from a maximum of 3.51 inches (VI-SC-20, Frederiksted 1.7 ESE) on St. Croix to a minimum of 0.62-inch of rain at VI-ST-5 (Charlotte Amalie West 4.2 WNW) on St. Thomas.
Intermediate rainfall measurements on St. Croix included 3.50 inches (VI-SC-23, Christiansted 6.5 W), 3.08 inches (VI-SC-34, Frederiksted 1.9 NE), 2.62 inches (VI-SC-18, Frederiksted 0.9 ESE), 2.30 inches (VI-SC-35, Frederiksted 1.3 ENE), 1.89 inches (VI-SC-30, Christiansted 1.7 SW), 1.66 inches (672560, East Hill), 1.55 inches (VI-SC-24, Christiansted 2.1 ENE), and 1.16 inches of rain at VI-SC-10 (Christiansted 1.6 E). SPI values for 1-, 3-, 6-, 9-, and 12 months were, respectively, 0.26, 1.01, 1.59, 1.29, and 0.96, indicating slightly drier conditions at the 1-month range. The USGS depth-to-water-level plot for the past 7-days shows the water level at the St. Croix Adventure 28 Well rose from 24.78 feet (8am AST Jul 31) to 24.15 feet (8am AST Aug 6). Water levels have remained relatively steady during last 30 days.
For St. Thomas, intermediate rainfall measurements included 2.64 inches (VI-ST-14, Nadir 0.3 E (Tropical Marine)), 1.43 inches (VI-ST-15, Charlotte Amalie West 1.3 N), 1.24 inches (VI-ST-13, Charlotte Amalie 1.2 NNW), and 0.62-inch of rain at VI-ST-5 (Charlotte Amalie West 4.2 WNW). The USGS depth-to-water-level plot for the past 7-days shows the water level at the St. Thomas Grade School 3 Well rose from 7.01 feet (8am AST Jul 31) to 5.90 feet (8am AST Aug 6). A significant drop in water level was noted from July 22-27, but the well water level has now largely recovered to where it was a month ago.
Intermediate rainfall measurements on St. John included 2.62 inches (VI-SJ-3, Windswept Beach), 1.57 inches (VI-SJ-5, Cruz Bay 1.6 E), and 0.69-inch of rain at VI-SJ-4 (Cruz Bay 0.8 NE). For Windswept Beach, the total monthly rainfall for July was 5.87 inches. The January-July period saw 35.14 inches of rain, ranking it as the second highest value for that 7-month period since records began in 1984 (the record of 38.70 inches was set back in 2010). Windswept Beach SPI values for 1-, 3-, 6-, 9-, and 12 months were, respectively, 0.76, 1.78, 1.84, 1.93, and 1.94. The USGS depth-to-water-level plot for the past 7-days shows the water level at the St. John Susannaberg DPW-3 Well rose from 8.82 feet (8am AST Jul 31) to 7.91’ (8am AST Aug 6). A fairly steady decline in water level was noted from Jul 6-31, followed by a very rapid rise on Aug 1.
Based on the 7-day observed rainfall observations, the SPI values, and USGS Well water levels, the USVI region continues to remain free of drought and dryness.
Pacific
In Alaska, an area of Abnormally Dry (D0) was added in the upper Tanana Valley in the southeast Interior in response to dry conditions during the past several weeks. For July, wet conditions were observed across much of the state with many locations observing the top ten wettest Julys on record, including at the Juneau Airport, Bethel, Nome, Anchorage, Fairbank, and Cordova, according to the Alaska Center for Climate Assessment and Policy.
On this week’s map, drought-related conditions deteriorated across the Hawaiian Islands (leeward sides) including the addition of an area of Extreme Drought (D3) added in Maui. Overall, windward slopes have received sufficient rainfall to keep significant drought at bay. However, leeward areas have continued to dry out as the summer progresses and reports of brush fires have been increasing across all counties, according to the National Weather Service in Honolulu. On Kauai and Maui, producers are reporting drought-related impacts due to poor forage conditions, according to the USDA Farm Service Agency.
Over the tropical western North Pacific, a monsoon trough developed during the first half of the drought week (Wed, Jul 31 – Tue, Aug 6, 2024), characterized by westerlies that extended back to Asia. By mid-week, areas of heavy rain developed in the monsoonal flow and intermittently overspread Guam and Rota. Quieter conditions ensued as Invest 94W (then centered near 24N 142E) moved northward and the enhanced convergence shifted north of the vicinity of the Marianas and western Federated States of Micronesia (FSM). Across the eastern FSM, passing troughs within weaker trade flow brought pockets of scattered showers to the region. For the South Pacific, a shearline trough approached American Samoa from the south later in the week, with numerous (but not very heavy) showers anticipated as the system passed to the north of the islands.
The recent trend of wet weather across the U.S.-Affiliated Pacific Islands helped to ameliorate El Nino-induced drought conditions that had developed in the Marianas and portions of the Marshall Islands early this year, and across parts of Micronesia in late 2023 or early 2024. With an apparent transition to La Nina underway, only northern sections of the Marianas are experiencing lingering dryness, with D0 observed for Saipan.
Satellite-based estimates of 7-day accumulated precipitation depict amounts of 0.5-2.0 inches across the Republic of the Marshall Islands (RMI), 1-4 inches over the FSM, 1-4+ inches over the Commonwealth of the Northern Mariana Islands (CNMI), and under 0.5-inch in the Republic of Palau. For American Samoa south of the equator, rainfall totals for the week were very light (less than 0.5-inch).
Across the RMI, Ailinglaplap reported 2.10 inches of rain for the week (1-day missing). This was also a “wet” week (i.e. the minimum weekly threshold value of 2 inches which meets most water needs was exceeded). Nine of the past 10 weeks have been wet at Ailinglaplap, and so was the month of July (15.88 inches, which was nearly double the monthly minimum of 8-inches required to meet most water needs). Majuro measured 1.84 inches of rain for the week, which fell a bit short of the 2-inch minimum. Only one of the past 12 weeks was “dry”, where the 2-inch weekly minimum was not met. The July rainfall total of 8.85 inches comfortably surpassed the 8-inch minimum requirement for the month. Majuro reported reservoir storage topping 30 million gallons each day during July, with a value of 31.843 million gallons (88% of capacity) on the final day of the month. Jaluit reported only 0.32-inch of precipitation for the week (1-day missing), which fell far short of the 2-inch weekly requirement. Jaluit’s monthly rainfall total for July was 7.05 inches, which also fell short of the monthly requirement of 8-inches. Unfortunately, there was missing (or suspect) data for the stations of Mili, Kwajalein, Wotje, and Utirik this week, so no analysis was performed for them.
For the FSM, weekly rainfall amounts ranged from a maximum of 4.35 inches (4-days missing) at Chuuk to 0.11-inch (5-days missing) at Lukunoch. Despite 4 days of missing data, Chuuk easily doubled the 2-inch weekly minimum required to meet most water needs, and almost doubled its monthly 8-inch minimum requirement, with 15.37 inches reported in July. In contrast, the station of Lukunoch fell far short of attaining the 2-inch weekly minimum rainfall, though the month of July was wet (9.21 inches, which surpassed the 8-inch minimum). For the remaining FSM stations, intermediate rainfall values for the week and month, respectively, include: Kosrae (2.69 inches with 2 days missing and 14.97 inches with 7 days missing), Ulithi (2.58 inches and 12.64 inches), Woleai (2.31 inches and 14.66 inches), North Fanif (1.20 inches and 15.72 inches), and Nukuoro (0.96-inch with 1 day missing data, and 17.41 inches). Yap came in with three-quarters of an inch for the week, and 20.23 inches in July, Kapingamarangi (0.74-inch of precipitation with one day missing, and 9.21 inches), Rumung (0.45-inch with 4 days missing, and 14.10 inches), and Pohnpei (0.21-inch with 1 day missing, and 21.09 inches for July). For Gilman (on the island of Yap), the July total rainfall amount was 22.03 inches, which almost triples the 8-inch monthly minimum requirement to meet most water needs. Missing data at Fananu and Pingelap precluded weekly analysis at those locations.
Across the CNMI, 7-day observed precipitation amounts ranged from a maximum of 5.58 inches (1-day missing) at Guam to 1.49 inches (1-day missing) at the Saipan ASOS site. Guam’s weekly rainfall total easily surpassed both its weekly and monthly minimum thresholds (1-inch and 4-inches, respectively). In July, Guam reported 7.51 inches of rain. The village of Mangilao reported a monthly total of 8.07 inches in July. Saipan continues to lag the other CNMI stations in terms of received rainfall amounts. The ASOS site (noted earlier) measured 3.07 inches of rain for the month of July, falling short of the 4-inch monthly minimum. A manual gauge at the Saipan International Airport measured 1.67 inches of rain for the week (1-day missing) and 3.74 inches (1-day missing) for the month of July. The “dry” month indicated at Saipan, followed by a “wet” week, helps to offset any additional deterioration, at least for the time being. Therefore its depiction continues at D0-S this week. Intermediate weekly/monthly rainfall amounts include 4.90 inches and 11.13 inches, respectively, at Agat; 4.85 inches (1-day missing) and 7.92 inches (Dededo), 2.90 inches and 2.75 inches (Tinian); and 2.31 inches and 6.61 inches (Rota). It is interesting to note that the July monthly rainfall received at Tinian was actually less than the most recent weekly rainfall.
A very dry week ensued for the Republic of Palau, especially after receiving heavy rainfall over the past few months. The Palau International Airport (Airai) measured only three-tenths of an inch of rain this past week (1-day missing). However, during July, 19.72 inches of precipitation fell, nearly 2.5 times the monthly minimum needed to meet most water needs. The Koror COOP received only 0.13-inch of rain this week (2-days missing), but like the International Airport also experienced a very wet July (21.46 inches).
South of the equator, American Samoa received very light amounts of precipitation during this past drought week. Pago Pago measured only 0.23- inch (2-days missing). However, for July, the 4-inch minimum rainfall requirement was surpassed, with the station reporting 4.50 inches. The higher elevation sites of Siufaga and Toa Ridges received 0.32-inch and 0.19-inch of rain this past week, respectively. Despite this very recent dryness, both sites were very wet in July, with each reporting about three times the monthly minimum requirement of 4-inches (12.88 inches and 11.05 inches, respectively).
Looking Ahead
The NWS Weather Prediction Center (WPC) 7-Day Quantitative Precipitation Forecast (QPF) calls for moderate-to-heavy rainfall accumulations ranging from 4 to 10 inches across areas of the Eastern Seaboard from Georgia to New England. Lesser accumulations, ranging from 1 to 2 inches, are expected across areas of the Four Corners states as well as in the Central Plains and southwestern portion of the Midwest. Elsewhere in the conterminous U.S., generally dry conditions are forecasted. The Climate Prediction Center (CPC) 6-10-day Outlook calls for a moderate-to-high probability of above-normal temperatures across much of the Four Corners States, much of the Plains states, the South, and Southeast. Conversely, below-normal temperatures are expected across much of California, eastern portions of the Midwest, and the Northeast. In terms of precipitation, there is a low-to-moderate probability of above-normal precipitation across the Pacific Northwest, Intermountain West, areas of the Desert Southwest, Central and Northern Plains, and in Alaska. Below-normal precipitation is expected across most of the South, Southeast, and western portions of the Great Basin.
Author(s):
David Simeral, Western Regional Climate Center
Anthony Artusa, NOAA/NWS/NCEP/CPC
Dryness Categories
D0 Abnormally Dry—used for areas showing dryness but not yet in drought, or for areas recovering from drought.
Drought Intensity Categories
D1 Moderate Drought
D2 Severe Drought
D3 Extreme Drought
D4 Exceptional Drought
Drought or Dryness Types
S Short-term, typically less than 6 months (agriculture, grasslands)
L Long-term, typically more than 6 months (hydrology, ecology)
SL Area contains both short- and long-term impacts
Source: National Drought Mitigation Center
