
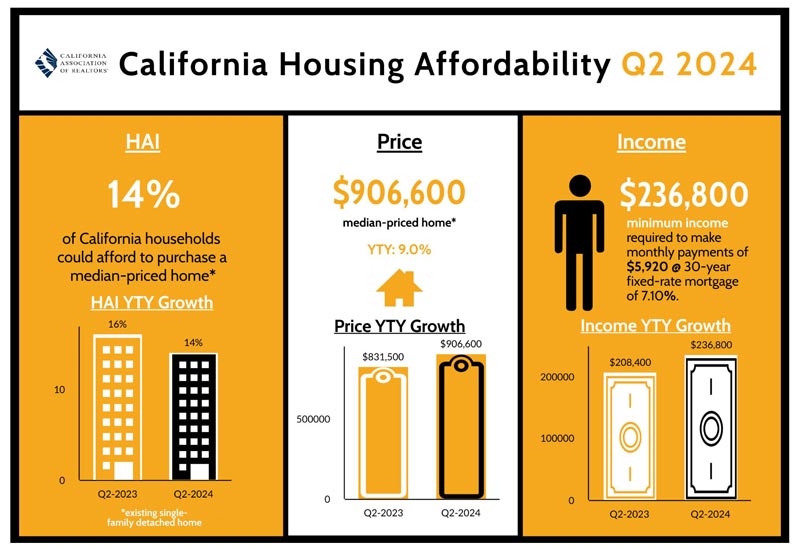
- Fourteen percent of California households could afford to purchase the $906,600 median-priced home in the second quarter of 2024, down from 17 percent in first-quarter 2024 and down from 16 percent in second-quarter 2023.
- A minimum annual income of $236,800 was needed to make monthly payments of $5,920, including principal, interest and taxes on a 30-year fixed-rate mortgage at a 7.10 percent interest rate.
- Twenty-two percent of home buyers were able to purchase the $690,000 median-priced condo or townhome. A minimum annual income of $180,000 was required to make a monthly payment of $4,500.
August 14, 2024 - LOS ANGELES - Higher prices combined with elevated mortgage rates that pushed borrowing costs to all-time highs pulled California’s housing affordability down to the lowest levels in nearly 17 years during the second quarter of 2024, the CALIFORNIA ASSOCIATION OF REALTORS® (C.A.R.) said on Tuesday.
Fourteen percent of the state’s homebuyers could afford to purchase a median-priced, existing single-family home in California in second-quarter 2024, down from 17 percent in the first quarter of 2024 and down from 16 percent in the second quarter of 2023, according to C.A.R.’s Traditional Housing Affordability Index (HAI).
The second-quarter 2024 figure is less than a third of the affordability index peak of 56 percent in the second quarter of 2012. Despite elevated mortgage rates in the second quarter, recent signs of weakness in macroeconomic reports have pushed rates down in the past few weeks. As the likelihood of the Fed cutting rates at the September meeting increases, housing affordability in California is expected to improve in the next quarter.
C.A.R.’s HAI measures the percentage of all households that can afford to purchase a median-priced, single-family home in California. C.A.R. also reports affordability indices for regions and select counties within the state. The index is considered the most fundamental measure of housing well-being for home buyers in the state.
A minimum annual income of $236,800 was needed to qualify for the purchase of a $906,600 statewide median-priced, existing single-family home in the second quarter of 2024. The monthly payment, including taxes and insurance (PITI) on a 30-year, fixed-rate loan, would be $5,920, assuming a 20 percent down payment and an effective composite interest rate of 7.10 percent. The effective composite interest rate was 6.68 percent in first-quarter 2024 and 6.61 percent in second-quarter 2023.
In the second quarter of 2024, the minimum annual income required exceeded $200,000 for the sixth time in seven quarters, setting a new record high. The monthly PITI for a typical single-family home in California also hit a record high, rising by double digits from both the previous quarter and the same quarter last year.
On a year-over-year basis, statewide home prices jumped 9.0 percent from second-quarter 2023, as competition and low inventory applied upward pressure on home prices. As the market moves past the spring home-buying season and transitions to the off season, home prices will likely decline as market competition cools and housing inventory continues to improve. A consistent drop in mortgage rates expected in the coming months will lower borrowing costs and improve affordability for the rest of the year.
The share of California households that could afford a typical condo/townhome in second-quarter 2024 fell to 22 percent, down from 24 percent recorded in the previous quarter and down from the 25 percent recorded in the second quarter of 2023. An annual income of $180,000 was required to make the monthly payment of $4,500 on the $690,000 median-priced condo/townhome in the second quarter of 2024.
Compared with California, about one-third of the nation’s households could afford to purchase a $422,100 median-priced home, which required a minimum annual income of $110,000 to make monthly payments of $2,750. Nationwide affordability was down from 36 percent a year ago.
In the second quarter of 2024, the nationwide minimum required annual income was half that of California's for the fifth consecutive quarter.
Key points from the second-quarter 2024 Housing Affordability report include:
- When compared to Q124, housing affordability in Q224 declined in 40 counties and remained unchanged in six. Seven counties showed quarter-to-quarter improvement in affordability mainly due to price declines in those counties. When compared to a year ago, six counties registered an improvement in affordability, while 39 counties throughout the state posted a decline on a year-over-year basis, and eight remained unchanged.
- Lassen (52 percent) remained the most affordable county in California, followed by Glenn (35 percent), Del Norte (34 percent), and Tehama (34 percent). Of all counties in California, Lassen continued to have the lowest minimum qualifying income ($65,200) to purchase a median-priced home in in second-quarter 2024.
- Mono (5 percent), Monterey (8 percent), and Santa Barbara (9 percent) were the least affordable counties in California, with each of the counties requiring a minimum income of at least $267,600 to purchase a median-priced home in the respective counties. San Mateo continued to require the highest minimum qualifying income ($574,800) to buy a median-priced home in the second quarter of 2024 and, together with Santa Clara ($524,000), were the only two counties in California with a minimum qualifying income more than $500,000. Marin and San Francisco came in third and fourth, requiring a minimum income of $469,200 and $444,000, respectively.
- Housing affordability declined the most on a year-over-year basis in Plumas, falling nine points from the previous year. Siskiyou recorded the second largest drop in affordability, moving seven percentage points below the same quarter of last year. Merced and Sutter had the third worst drop in affordability, decreasing six percentage points each from a year ago. Despite higher household income, higher home prices and elevated mortgage rates continue to keep housing affordability near its all-time lows across most counties.
See C.A.R.’s historical housing affordability data.
See first-time buyer housing affordability data.
Leading the way…® in California real estate for more than 110 years, the CALIFORNIA ASSOCIATION OF REALTORS® (www.car.org) is one of the largest state trade organizations in the United States with nearly 200,000 members dedicated to the advancement of professionalism in real estate. C.A.R. is headquartered in Los Angeles.
CALIFORNIA ASSOCIATION OF REALTORS®
Traditional Housing Affordability Index
Second quarter 2024
|
2nd Qtr. 2024 |
C.A.R. Traditional Housing Affordability Index |
|||||||
|
STATE/REGION/COUNTY |
2nd Qtr. 2024 |
1st Qtr. 202 |
2nd Qtr. 2023 |
Median Home Price |
Monthly Payment Including Taxes & Insurance |
Minimum Qualifying Income |
||
|
Calif. Single-family homes |
14 |
17 |
16 |
$906,600 |
$5,920 |
$236,800 |
||
|
Calif. Condo/Townhomes |
22 |
24 |
25 |
$690,000 |
$4,500 |
$180,000 |
||
|
Los Angeles Metro Area |
13 |
15 |
17 |
$840,000 |
$5,480 |
$219,200 |
||
|
Inland Empire |
20 |
21 |
22 |
$600,000 |
$3,910 |
$156,400 |
||
|
San Francisco Bay Area |
18 |
20 |
19 |
$1,430,000 |
$9,330 |
$373,200 |
||
|
United States |
33 |
37 |
36 |
$422,100 |
$2,750 |
$110,000 |
||
|
San Francisco Bay Area |
||||||||
|
Alameda |
16 |
16 |
16 |
$1,399,500 |
$9,130 |
$365,200 |
||
|
Contra Costa |
21 |
25 |
23 |
$925,000 |
$6,040 |
$241,600 |
||
|
Marin |
16 |
18 |
16 |
$1,797,000 |
$11,730 |
$469,200 |
||
|
Napa |
14 |
18 |
19 |
$962,500 |
$6,280 |
$251,200 |
||
|
San Francisco |
19 |
20 |
20 |
$1,701,000 |
$11,100 |
$444,000 |
||
|
San Mateo |
16 |
17 |
17 |
$2,202,300 |
$14,370 |
$574,800 |
||
|
Santa Clara |
16 |
18 |
18 |
$2,008,000 |
$13,100 |
$524,000 |
||
|
Solano |
24 |
26 |
26 |
$600,000 |
$3,910 |
$156,400 |
||
|
Sonoma |
16 |
16 |
16 |
$850,000 |
$5,550 |
$222,000 |
||
|
Southern California |
||||||||
|
Imperial |
26 |
30 |
30 |
$395,000 |
$2,580 |
$103,200 |
||
|
Los Angeles |
13 |
14 |
15 |
$854,760 |
$5,580 |
$223,200 |
||
|
Orange |
11 |
11 |
12 |
$1,437,500 |
$9,380 |
$375,200 |
||
|
Riverside |
18 |
20 |
20 |
$650,000 |
$4,240 |
$169,600 |
||
|
San Bernardino |
25 |
27 |
30 |
$510,000 |
$3,330 |
$133,200 |
||
|
San Diego |
11 |
11 |
13 |
$1,050,000 |
$6,850 |
$274,000 |
||
|
Ventura |
12 |
15 |
14 |
$940,000 |
$6,130 |
$245,200 |
||
|
Central Coast |
||||||||
|
Monterey |
8 |
11 |
12 |
$1,025,000 |
$6,690 |
$267,600 |
||
|
San Luis Obispo |
11 |
10 |
11 |
$889,500 |
$5,800 |
$232,000 |
||
|
Santa Barbara |
9 |
11 |
10 |
$1,372,500 |
$8,960 |
$358,400 |
||
|
Santa Cruz |
13 |
13 |
13 |
$1,375,000 |
$8,970 |
$358,800 |
||
|
Central Valley |
||||||||
|
Fresno |
28 |
30 |
29 |
$425,000 |
$2,770 |
$110,800 |
||
|
Glenn |
35 |
34 |
32 |
$340,450 |
$2,220 |
$88,800 |
||
|
Kern |
30 |
31 |
31 |
$385,000 |
$2,510 |
$100,400 |
||
|
Kings |
29 |
34 |
32 |
$380,000 |
$2,480 |
$99,200 |
||
|
Madera |
29 |
30 |
31 |
$430,000 |
$2,810 |
$112,400 |
||
|
Merced |
25 |
29 |
31 |
$415,000 |
$2,710 |
$108,400 |
||
|
Placer |
28 |
30 |
29 |
$675,500 |
$4,410 |
$176,400 |
||
|
Sacramento |
24 |
26 |
26 |
$555,000 |
$3,620 |
$144,800 |
||
|
San Benito |
18 |
21 |
19 |
$805,000 |
$5,250 |
$210,000 |
||
|
San Joaquin |
24 |
26 |
26 |
$550,000 |
$3,590 |
$143,600 |
||
|
Stanislaus |
25 |
28 |
27 |
$489,250 |
$3,190 |
$127,600 |
||
|
Tulare |
30 |
33 |
33 |
$377,000 |
$2,460 |
$98,400 |
||
|
Far North |
||||||||
|
Butte |
27 |
29 |
29 |
$452,470 |
$2,950 |
$118,000 |
||
|
Lassen |
52 |
51 |
52 |
$249,950 |
$1,630 |
$65,200 |
||
|
Plumas |
29 |
37 |
38 |
$426,000 |
$2,780 |
$111,200 |
||
|
Shasta |
33 |
37 |
35 |
$379,900 |
$2,480 |
$99,200 |
||
|
Siskiyou |
31 |
32 |
39 |
$332,000 |
$2,170 |
$86,800 |
||
|
Tehama |
34 |
39 |
35 |
$350,000 |
$2,280 |
$91,200 |
||
|
Trinity |
28 |
26 |
31 |
$304,600 |
$1,990 |
$79,600 |
||
|
Other Calif. Counties |
||||||||
|
Amador |
32 |
30 |
28 |
$437,450 |
$2,850 |
$114,000 |
||
|
Calaveras |
29 |
33 |
27 |
$481,000 |
$3,140 |
$125,600 |
||
|
Del Norte |
34 |
34 |
30 |
$345,000 |
$2,250 |
$90,000 |
||
|
El Dorado |
22 |
25 |
23 |
$720,000 |
$4,700 |
$188,000 |
||
|
Humboldt |
22 |
25 |
25 |
$445,000 |
$2,900 |
$116,000 |
||
|
Lake |
31 |
33 |
28 |
$345,000 |
$2,250 |
$90,000 |
||
|
Mariposa |
25 |
23 |
24 |
$407,780 |
$2,660 |
$106,400 |
||
|
Mendocino |
17 |
21 |
17 |
$525,000 |
$3,430 |
$137,200 |
||
|
Mono |
5 |
4 |
5 |
$1,088,190 |
$7,100 |
$284,000 |
||
|
Nevada |
24 |
27 |
25 |
$585,000 |
$3,820 |
$152,800 |
||
|
Sutter |
27 |
32 |
33 |
$440,000 |
$2,870 |
$114,800 |
||
|
Tuolumne |
31 |
36 |
32 |
$437,000 |
$2,850 |
$114,000 |
||
|
Yolo |
22 |
24 |
23 |
$640,000 |
$4,180 |
$167,200 |
||
|
Yuba |
25 |
26 |
26 |
$446,400 |
$2,910 |
$116,400 |
||
r = revised
Traditional Housing Affordability Indices (HAI) were calculated based on the following effective composite interest rates: 7.10% (2Qtr. 2024), 6.68% (1Qtr. 2023) and 6.61% (2Qtr. 2023).
Source: CAR