
Important Note: August 2026 employment data is based on the survey week that included August 12. The release date for September 2026 data is scheduled for October 16.
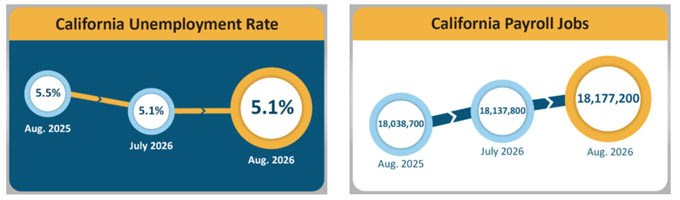
September 19, 2026 - SACRAMENTO — California added 39,400 nonfarm payroll jobs1 in August while the unemployment rate remained at 5.1 percent2 according to the latest data from the Employment Development Department (EDD). The rate is down 0.4% from August 2025.
California had 18,177,200 payroll jobs in August, an increase from both July and August 2025. The State had 138,500 more payroll jobs than a year ago. July’s job total was also revised upward by 4,800 jobs, lowering the estimated job loss in July to 15,700.
The August employment data comes from two separate surveys. The payroll survey measures the number of jobs at California businesses. The household survey measures employment and unemployment among Californians.
California's Labor Market, by the Numbers...
- California’s August 2026 nonfarm job gain (+39,400) made up more than 24 percent of the nation’s job growth (+162,000) for the month.
- California has added 114,700 jobs since the beginning of 2026 (Jan. 2026 through Aug. 2026), which averages out to 14,340 jobs per month. Since January, the State has contributed 17.8 percent of the nation’s overall job growth (+643,000).
- The number of unemployed Californians decreased by 14,000 in August. That marks the State’s ninth consecutive monthly decline with a total of 101,300 fewer unemployed people over that timeframe. Unemployment is now at its lowest level since December 2023.
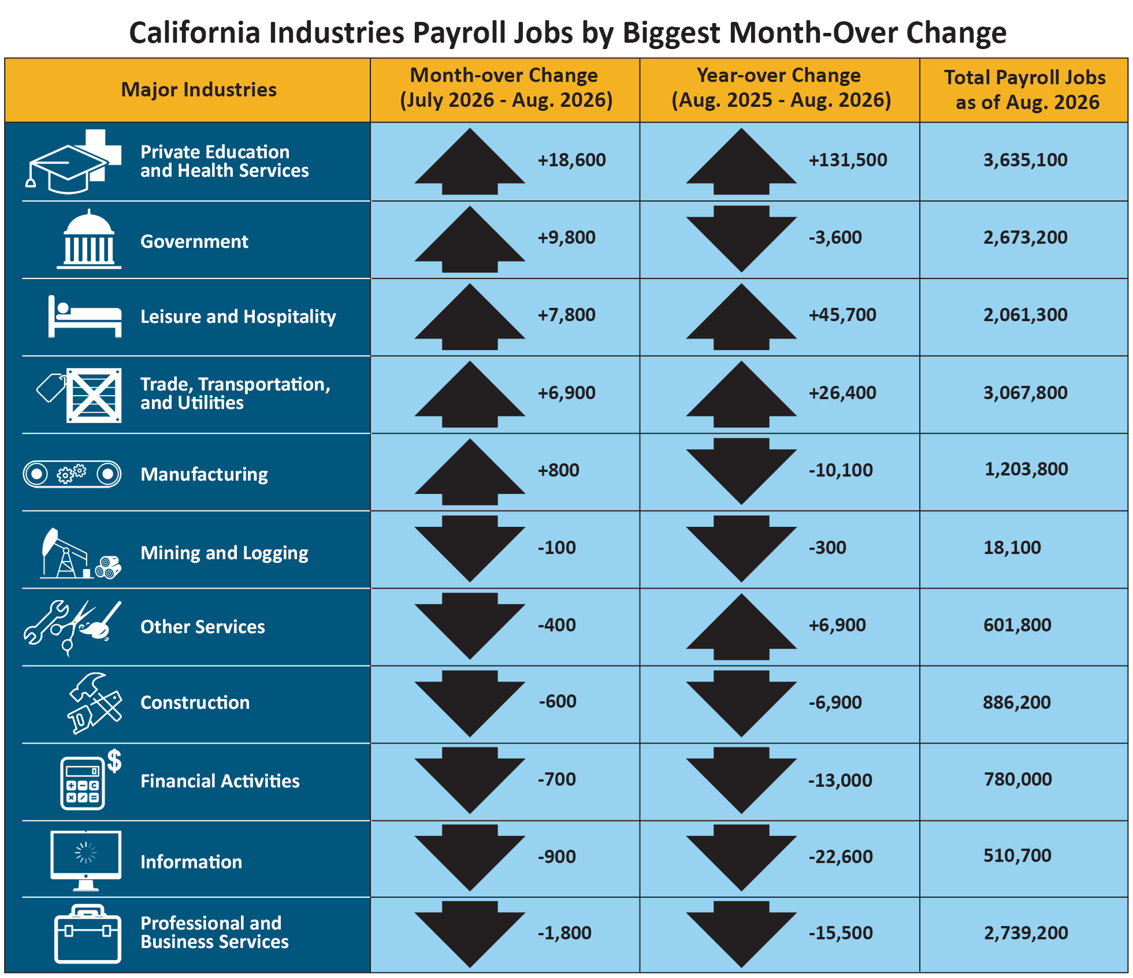
- Five of California's 11 industry sectors added jobs in August, led by Private Education & Health Services (+18,600). Above-average gains were recorded in Outpatient Care Centers, Home Health Care Services, and General and Medical Surgical Hospitals. Over the past year, the sector added 131,500 jobs, more than double the gain in Leisure and Hospitality (+45,700), the next highest-gaining sector.
- Government (+9,800) also saw an increase in employment, which was led by Local Government Educational Services as the new school year kicked off across the State.
- Professional & Business Services (-1,800) posted the State’s largest month-over job loss going against trend for this time of year, driven primarily by declines in jobs related to Legal Services, Accounting, Tax Preparation, and Bookkeeping Services, and computer-related fields.
1. The nonfarm payroll job numbers come from a federal survey of 80,000 California businesses.
2. The unemployment rate comes from a separate federal survey of 4,400 California households.
Data Trends about Jobs in the Economy
Total Nonfarm Payroll Jobs (Comes from a monthly survey of approximately 80,000 California businesses – seasonally adjusted)
- Month-over – Total nonfarm jobs in California’s 11 major industries amounted to 18,177,200 in August – a gain of 39,400 from July. This followed July’s upward revision of 4,800 jobs, resulting in a month-over July loss of 15,700 jobs.
- Year-over – Total nonfarm jobs increased by 138,500 (0.77 percent increase) from August 2025 to August 2026 compared to the U.S. year-over gain of 603,000 jobs (0.38 percent increase).
Total Farm Jobs – The number of jobs in the agriculture industry decreased by 3,900 in August to a total of 411,400 jobs. The agriculture industry had 15,500 more farm jobs in August 2026 than it did in August 2025.
Data Trends about Workers in the Economy
Employment and Unemployment in California (Based on a monthly federal survey of 4,400 California households which focuses on workers in the economy)
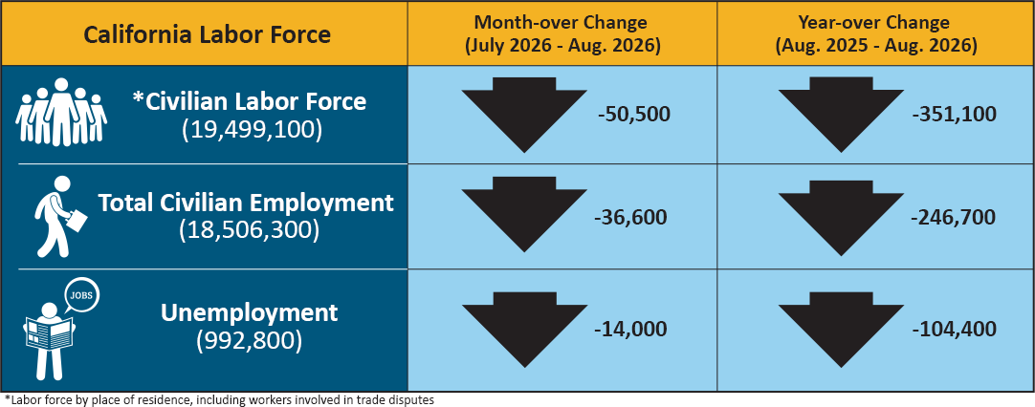
- Employed – The number of Californians employed in August was 18,506,300, a decrease of 36,600 from July and down 246,700 compared to August of last year.
- Unemployed – The number of unemployed Californians was 992,800 in August, a decrease of 14,000 from July and a decrease of 104,400 from August 2025.
Unemployment Insurance Claims (Not Seasonally Adjusted)
The following data is from a sample week that includes the 19th of each month:
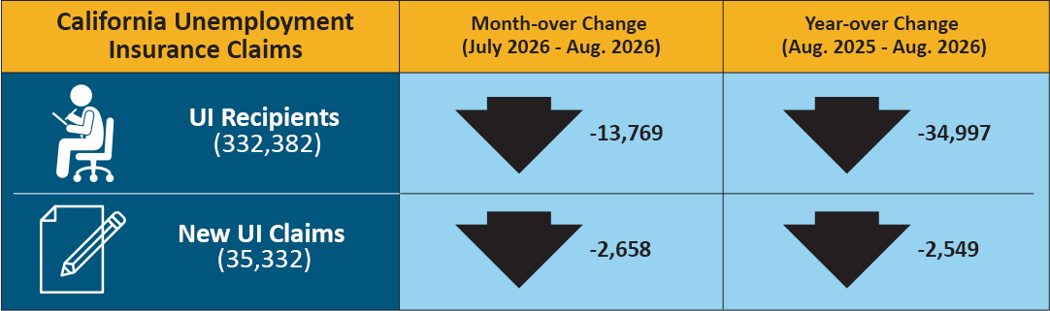
In related data that figures into the State’s unemployment rate, there were 332,382 people certifying for Unemployment Insurance (UI) benefits during the August 2026 sample week. That compares to 346,151 people in July and 367,379 people in August 2025. Concurrently, 35,332 initial claims were processed in the August 2026 sample week, which was a month-over decrease of 2,658 claims from July and a year-over decrease of 2,549 claims from August 2025.
| County | Labor Force | Employment | Unemployment | Rate |
|---|---|---|---|---|
| STATE TOTAL | 19,491,000 | 18,446,700 | 1,044,300 | 5.4% |
| ALAMEDA | 855,600 | 814,000 | 41,600 | 4.9% |
| ALPINE | 430 | 380 | 40 | 10.4% |
| AMADOR | 15,030 | 14,150 | 880 | 5.8% |
| BUTTE | 89,700 | 84,100 | 5,600 | 6.2% |
| CALAVERAS | 17,570 | 16,460 | 1,110 | 6.3% |
| COLUSA | 11,800 | 10,700 | 1,100 | 9.4% |
| CONTRA COSTA | 574,200 | 545,500 | 28,700 | 5.0% |
| DEL NORTE | 9,310 | 8,710 | 600 | 6.5% |
| EL DORADO | 89,500 | 84,900 | 4,600 | 5.1% |
| FRESNO | 471,900 | 434,900 | 36,900 | 7.8% |
| GLENN | 11,730 | 10,910 | 830 | 7.1% |
| HUMBOLDT | 58,900 | 55,600 | 3,300 | 5.6% |
| IMPERIAL | 76,300 | 59,600 | 16,700 | 21.9% |
| INYO | 8,380 | 7,980 | 400 | 4.7% |
| KERN | 414,000 | 379,300 | 34,800 | 8.4% |
| KINGS | 59,900 | 54,800 | 5,100 | 8.5% |
| LAKE | 26,730 | 24,800 | 1,930 | 7.2% |
| LASSEN | 8,070 | 7,540 | 540 | 6.6% |
| LOS ANGELES | 4,990,400 | 4,743,500 | 247,000 | 4.9% |
| MADERA | 70,400 | 65,200 | 5,200 | 7.4% |
| MARIN | 122,700 | 117,300 | 5,400 | 4.4% |
| MARIPOSA | 7,930 | 7,490 | 440 | 5.6% |
| MENDOCINO | 36,480 | 34,440 | 2,040 | 5.6% |
| MERCED | 121,900 | 111,000 | 10,900 | 8.9% |
| MODOC | 3,110 | 2,920 | 190 | 6.1% |
| MONO | 8,790 | 8,410 | 380 | 4.3% |
| MONTEREY | 228,400 | 215,400 | 13,000 | 5.7% |
| NAPA | 74,000 | 70,800 | 3,200 | 4.3% |
| NEVADA | 47,550 | 45,190 | 2,370 | 5.0% |
| ORANGE | 1,601,900 | 1,530,800 | 71,100 | 4.4% |
| PLACER | 207,500 | 198,100 | 9,400 | 4.5% |
| PLUMAS | 8,080 | 7,620 | 460 | 5.7% |
| RIVERSIDE | 1,183,600 | 1,110,700 | 72,900 | 6.2% |
| SACRAMENTO | 781,600 | 740,300 | 41,300 | 5.3% |
| SAN BENITO | 35,100 | 33,000 | 2,100 | 5.9% |
| SAN BERNARDINO | 1,020,600 | 962,900 | 57,700 | 5.7% |
| SAN DIEGO | 1,640,000 | 1,559,600 | 80,300 | 4.9% |
| SAN FRANCISCO | 499,100 | 478,100 | 21,000 | 4.2% |
| SAN JOAQUIN | 369,700 | 345,600 | 24,200 | 6.5% |
| SAN LUIS OBISPO | 132,300 | 126,100 | 6,200 | 4.7% |
| SAN MATEO | 408,400 | 392,100 | 16,300 | 4.0% |
| SANTA BARBARA | 224,000 | 213,700 | 10,300 | 4.6% |
| SANTA CLARA | 1,034,300 | 990,300 | 44,000 | 4.3% |
| SANTA CRUZ | 139,000 | 131,600 | 7,400 | 5.3% |
| SHASTA | 81,600 | 77,300 | 4,300 | 5.3% |
| SIERRA | 1,560 | 1,490 | 70 | 4.4% |
| SISKIYOU | 16,260 | 15,080 | 1,180 | 7.3% |
| SOLANO | 216,600 | 204,700 | 11,800 | 5.5% |
| SONOMA | 246,000 | 235,000 | 11,000 | 4.5% |
| STANISLAUS | 253,200 | 235,500 | 17,700 | 7.0% |
| SUTTER | 46,200 | 42,800 | 3,400 | 7.4% |
| TEHAMA | 27,390 | 25,710 | 1,690 | 6.2% |
| TRINITY | 5,710 | 5,400 | 310 | 5.5% |
| TULARE | 215,900 | 193,500 | 22,400 | 10.4% |
| TUOLUMNE | 22,050 | 20,810 | 1,240 | 5.6% |
| VENTURA | 414,400 | 393,600 | 20,800 | 5.0% |
| YOLO | 112,300 | 105,900 | 6,400 | 5.7% |
| YUBA | 35,900 | 33,500 | 2,400 | 6.7% |
Source: CA. EDD