


March 2, 2015 - Public spending—spending by federal, state, and local governments—on transportation and water infrastructure totaled $416 billion in 2014. Most of that spending came from state and local governments: They provided $320 billion, and the federal government accounted for $96 billion.
This report provides information on spending for six types of transportation and water infrastructure:
- Highways,
- Mass transit and rail,
- Aviation,
- Water transportation,
- Water resources, and
- Water utilities.
Prices of Materials and Other Inputs Used for Transportation and Water Infrastructure Began to Rise Rapidly in 2003
In 2003, the average price of materials (asphalt, concrete, and cement, for example) and other inputs used to build, operate, and maintain transportation and water infrastructure began to rise rapidly. Nominal public spending on that infrastructure increased by 44 percent between 2003 and 2014, but because prices of materials and other inputs rose more quickly than nominal spending, real (inflation-adjusted) public purchases decreased, falling by 9 percent from their peak in 2003 to their level in 2014 (see figure below).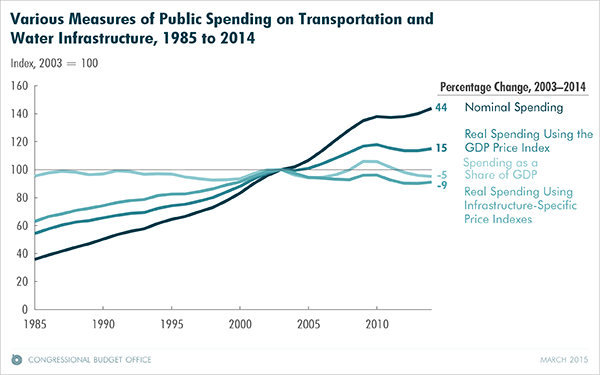
This report is concerned primarily with real spending as calculated using infrastructure-specific price indexes. Such measurements most comprehensively illustrate changes in real purchases over time, with a decrease in real spending representing fewer lane-miles of highways or fewer airport runways, for example.
Other measurements provide different perspectives on changes in public spending on transportation and water infrastructure, especially for the 2003–2014 period. Adjusting nominal spending to remove the effects of inflation using the gross domestic product (GDP) price index can be helpful when examining changes in the allocation of real budgetary resources over time. Because prices in the economy as a whole rose at less than half of the rate of prices of infrastructure-related materials from 2003 to 2014, real infrastructure spending adjusted with the GDP price index rose by 15 percent. By contrast, measured as a percentage of GDP, spending on transportation and water infrastructure fell by 5 percent during that period.
The decline in real public spending (adjusted using infrastructure-specific price indexes) on transportation and water infrastructure between 2003 and 2014 occurred almost exclusively within the category of capital purchases, which fell by 23 percent during those years. The construction and rehabilitation of highways, in particular, declined over the period. By contrast, real public spending for the operation and maintenance of infrastructure continued its historical tendency to grow, rising by about 6 percent over that period, primarily because of increases at the state and local level.
Although all levels of government have spent less, in real terms, on transportation and water infrastructure in recent years than in the past, the greatest reduction has occurred at the federal level. Adjusted for inflation, federal purchases have fallen by about 19 percent since 2003, while purchases by states and localities have fallen by about 5 percent. The significant difference between those declines reflects the facts that a much larger portion of federal infrastructure spending than of state and local spending is for capital and that capital has become much more expensive to purchase over the period relative to operation and maintenance services.
The costs of building transportation and water infrastructure in the future will depend on a number of factors, but at least one development—the recent decline in the price of oil—suggests that those costs might soon increase at a slower rate. Not only is petroleum used as fuel in construction vehicles, it also is an important component of the asphalt used to build highways and runways.

