


IMPORTANT NOTE: The employment data for the month of September 2022 is taken from the survey week including Sept. 12th. Data for the month of October is scheduled for release on November 18, 2022.
Employers added 6,500 nonfarm payroll jobs
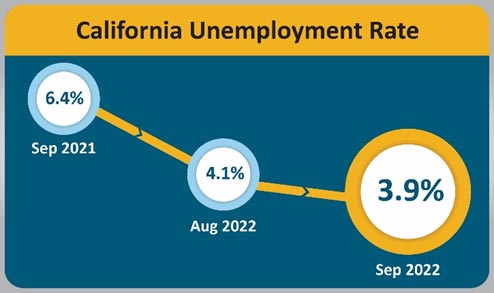
October 22, 2022 - SACRAMENTO – California’s unemployment rate decreased in the month of September 2022 to a record-tying low of 3.9 percent1 in the current data series, as the state’s employers added 6,500 nonfarm payroll jobs2 to the economy, according to data released on Friday by the California Employment Development Department (EDD) from two surveys.
California’s Labor Market, by the Numbers...
- September 2022’s statewide unemployment rate of 3.9 percent is tied with July 2022 as the lowest ever on record in a data series that dates back to 1976.
- The state has now regained 99.1 percent (2,734,200) of the 2,758,900 nonfarm jobs lost during March and April of 2020 due to the COVID-19 pandemic.
- September 2022 marked the 12th consecutive month of nonfarm job gains, which now totals a 712,600 job gain over that time period.
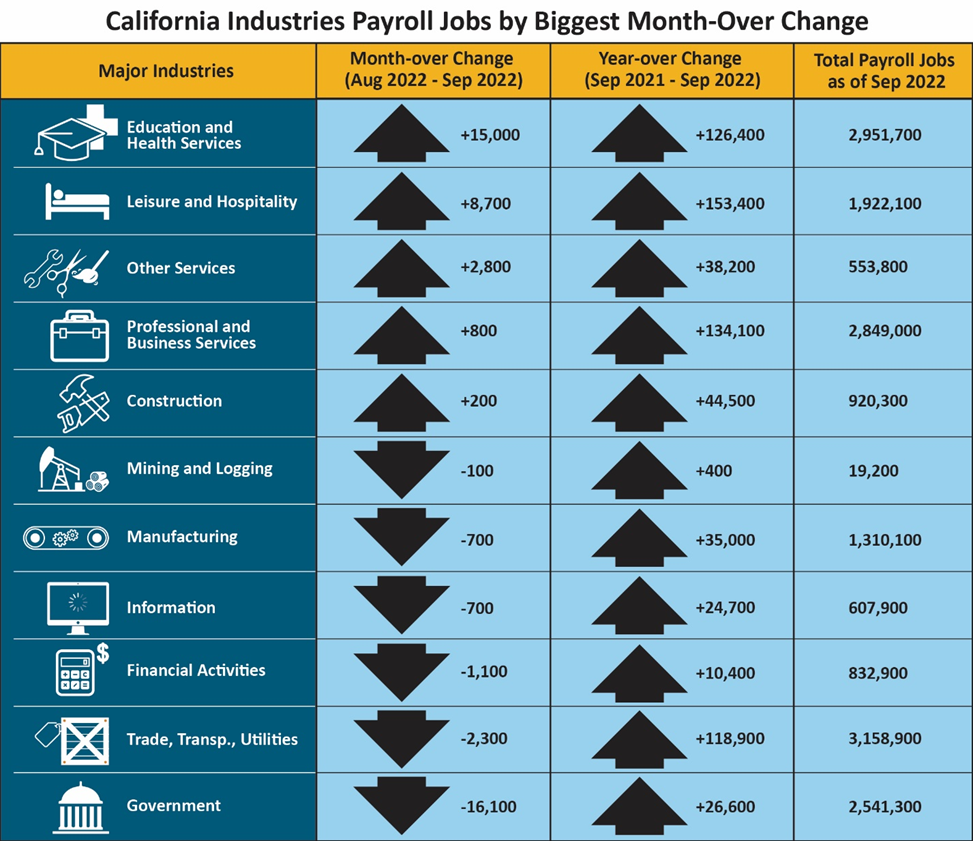
- Only five of California’s 11 industry sectors gained jobs in September with Education & Health Services (+15,000) showing the largest month-over gains thanks to strength in payrolls within Colleges, Universities, & Professional Schools.
- Leisure & Hospitality’s gains (+8,700) came largely from Special Food Services, such as (for example) catering and food trucks.
- Losses in Government (-16,100) by and large were due to weakness in local government hiring, outside of education. For example, reductions in administration and services.
1. The unemployment rate comes from a separate federal survey of 5,100 California households.
2. The nonfarm payroll job numbers come from a federal survey of 80,000 California businesses.
Data Trends about Jobs in the Economy
Total Nonfarm Payroll Jobs
Total Nonfarm Payroll Jobs (Comes from a monthly survey of approximately 80,000 California businesses that estimates jobs in the economy – seasonally adjusted)
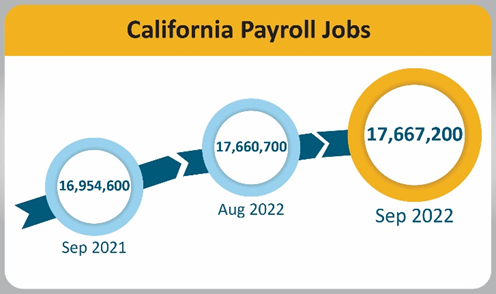
- Month-over – Total nonfarm jobs in California’s 11 major industries totaled 17,667,200 in September – a net gain 6,500 jobs from August. This followed an upwards revised (+16,100) month-over gain of 36,000 jobs in August.
- Year-over – Total nonfarm jobs increased by 712,600 (a 4.2 percent increase) from September 2021 to September 2022 compared to the U.S. annual gain of 5,690,000 jobs (a 3.9 percent increase).
 EEOmail@edd.ca.gov or call toll free 1-866-490-8879." width="100%" style="box-sizing: border-box; vertical-align: middle; border-style: none;">
Total Farm jobs – The number of jobs in the agriculture industry decreased from August by 700 to a total of 410,800 jobs in September. The agricultural industry had 7,600 more farm jobs in September 2022 than it did in September a year ago.
Data Trends about Workers in the Economy
Employment and Unemployment in California (Based on a monthly federal survey of 5,100 California households which focuses on workers in the economy)
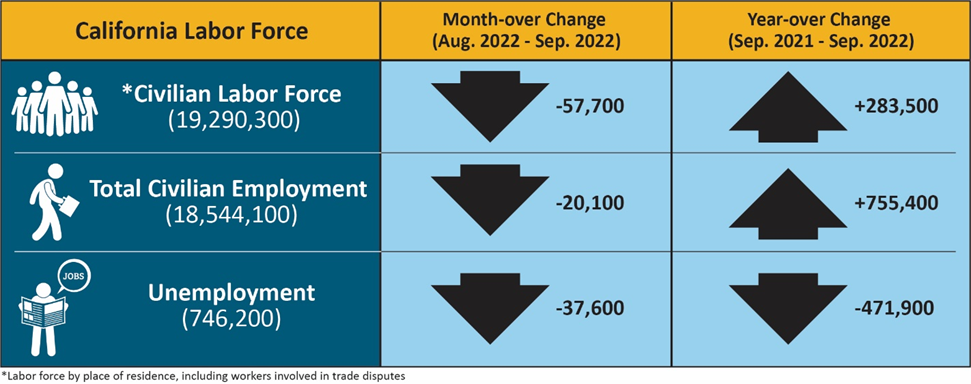
- Employed – The number of Californians employed in September was 18,544,100, a decrease of 20,100 persons from August’s total of 18,564,200, but up 755,400 from the employment total in September 2021.
- Unemployed – The number of unemployed Californians was 746,200 in September, a decrease of 37,600 over the month and down 471,900 in comparison to September 2021.
Unemployment Insurance Claims (Not Seasonally Adjusted)
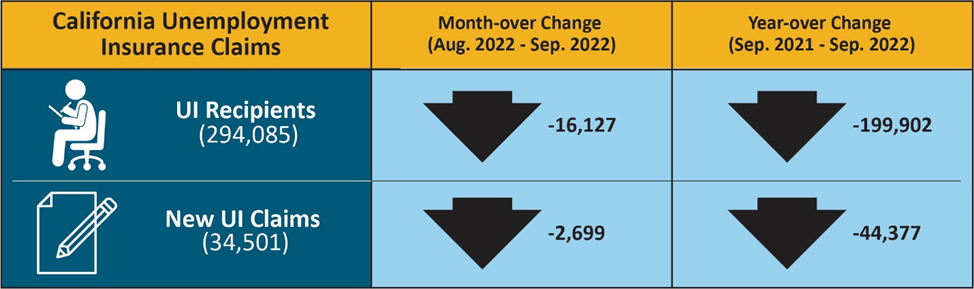
The following data is from a sample week that includes the 19th of each month: In related data that figures into the state’s unemployment rate, there were 294,085 people certifying for Unemployment Insurance benefits during the September 2022 sample week. That compares to 310,212 people in August and 493,987 people in September 2021. Concurrently, 34,501 initial claims were processed in the September 2022 sample week, which was a month-over decrease of 2,699 claims from August and a year-over decrease of 44,377 claims from September 2021.
| COUNTY | LABOR FORCE | EMPLOYMENT | UNEMPLOYMENT | RATE |
|---|---|---|---|---|
| STATE TOTAL | 19,284,300 | 18,568,000 | 716,300 | 3.7% |
| ALAMEDA | 830,400 | 806,500 | 23,900 | 2.9% |
| ALPINE | 460 | 430 | 20 | 5.0% |
| AMADOR | 14,530 | 13,980 | 550 | 3.8% |
| BUTTE | 93,400 | 90,000 | 3,500 | 3.7% |
| CALAVERAS | 22,200 | 21,550 | 650 | 2.9% |
| COLUSA | 11,440 | 10,640 | 800 | 7.0% |
| CONTRA COSTA | 554,700 | 537,700 | 17,000 | 3.1% |
| DEL NORTE | 9,590 | 9,180 | 410 | 4.3% |
| EL DORADO | 93,000 | 90,500 | 2,600 | 2.8% |
| FRESNO | 455,300 | 430,500 | 24,800 | 5.4% |
| GLENN | 12,750 | 12,180 | 570 | 4.5% |
| HUMBOLDT | 60,800 | 58,900 | 2,000 | 3.2% |
| IMPERIAL | 70,500 | 59,200 | 11,300 | 16.0% |
| INYO | 8,390 | 8,160 | 240 | 2.8% |
| KERN | 392,700 | 368,500 | 24,200 | 6.2% |
| KINGS | 56,300 | 53,000 | 3,200 | 5.8% |
| LAKE | 29,100 | 27,870 | 1,230 | 4.2% |
| LASSEN | 9,230 | 8,930 | 300 | 3.2% |
| LOS ANGELES | 4,942,300 | 4,721,500 | 220,900 | 4.5% |
| MADERA | 63,300 | 60,000 | 3,300 | 5.2% |
| MARIN | 130,400 | 127,600 | 2,800 | 2.2% |
| MARIPOSA | 7,470 | 7,200 | 270 | 3.7% |
| MENDOCINO | 38,200 | 37,000 | 1,200 | 3.1% |
| MERCED | 119,100 | 111,900 | 7,200 | 6.0% |
| MODOC | 3,270 | 3,150 | 120 | 3.6% |
| MONO | 8,760 | 8,460 | 300 | 3.4% |
| MONTEREY | 219,600 | 210,700 | 8,900 | 4.0% |
| NAPA | 70,700 | 68,800 | 1,900 | 2.6% |
| NEVADA | 48,580 | 47,270 | 1,320 | 2.7% |
| ORANGE | 1,603,800 | 1,560,000 | 43,800 | 2.7% |
| PLACER | 193,200 | 188,300 | 4,900 | 2.5% |
| PLUMAS | 7,830 | 7,480 | 350 | 4.4% |
| RIVERSIDE | 1,166,600 | 1,120,500 | 46,100 | 4.0% |
| SACRAMENTO | 726,200 | 700,500 | 25,700 | 3.5% |
| SAN BENITO | 33,100 | 31,800 | 1,300 | 3.9% |
| SAN BERNARDINO | 1,020,300 | 981,400 | 39,000 | 3.8% |
| SAN DIEGO | 1,584,800 | 1,536,200 | 48,600 | 3.1% |
| SAN FRANCISCO | 577,400 | 565,200 | 12,200 | 2.1% |
| SAN JOAQUIN | 338,400 | 321,900 | 16,400 | 4.9% |
| SAN LUIS OBISPO | 137,500 | 134,100 | 3,400 | 2.5% |
| SAN MATEO | 457,000 | 448,100 | 8,900 | 1.9% |
| SANTA BARBARA | 226,400 | 220,400 | 6,100 | 2.7% |
| SANTA CLARA | 1,057,200 | 1,034,900 | 22,400 | 2.1% |
| SANTA CRUZ | 137,600 | 132,900 | 4,700 | 3.4% |
| SHASTA | 72,400 | 69,600 | 2,800 | 3.8% |
| SIERRA | 1,420 | 1,380 | 40 | 2.5% |
| SISKIYOU | 16,760 | 16,030 | 730 | 4.3% |
| SOLANO | 201,400 | 193,700 | 7,700 | 3.8% |
| SONOMA | 250,800 | 244,400 | 6,400 | 2.5% |
| STANISLAUS | 241,200 | 229,700 | 11,500 | 4.8% |
| SUTTER | 45,900 | 43,500 | 2,400 | 5.3% |
| TEHAMA | 26,230 | 25,170 | 1,060 | 4.0% |
| TRINITY | 4,560 | 4,410 | 160 | 3.4% |
| TULARE | 206,000 | 190,600 | 15,400 | 7.5% |
| TUOLUMNE | 19,950 | 19,200 | 750 | 3.8% |
| VENTURA | 413,700 | 400,200 | 13,500 | 3.3% |
| YOLO | 109,000 | 105,600 | 3,400 | 3.1% |
| YUBA | 31,100 | 29,500 | 1,500 | 4.9% |

