


IMPORTANT NOTE: The employment data for the month of November 2022 is taken from the survey week including Nov. 12th. Data for the month of December is scheduled for release on Jan. 20, 2023.
Employers added 26,800 nonfarm payroll jobs
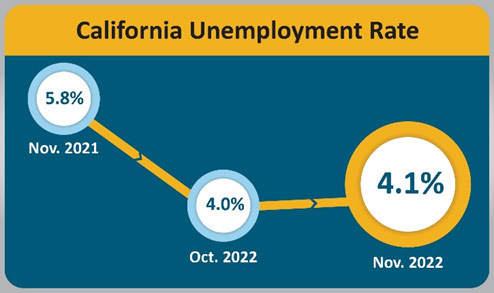
December 17, 2022 - SACRAMENTO – California’s unemployment rate increased in the month of November 2022 to 4.1 percent1 despite the state’s employers adding 26,800 nonfarm payroll jobs2 to the economy, according to data released on Friday by the California Employment Development Department (EDD) from two surveys.
California’s Labor Market, by the Numbers...
- Year over, California job growth (4.0 percent) has outpaced the US as a whole (3.3 percent) by 0.7 percentage points.
- November 2022 marked the 14th consecutive month of nonfarm job gains, which now totals 798,000 jobs over that time period for a monthly average gain of 57,000 jobs.
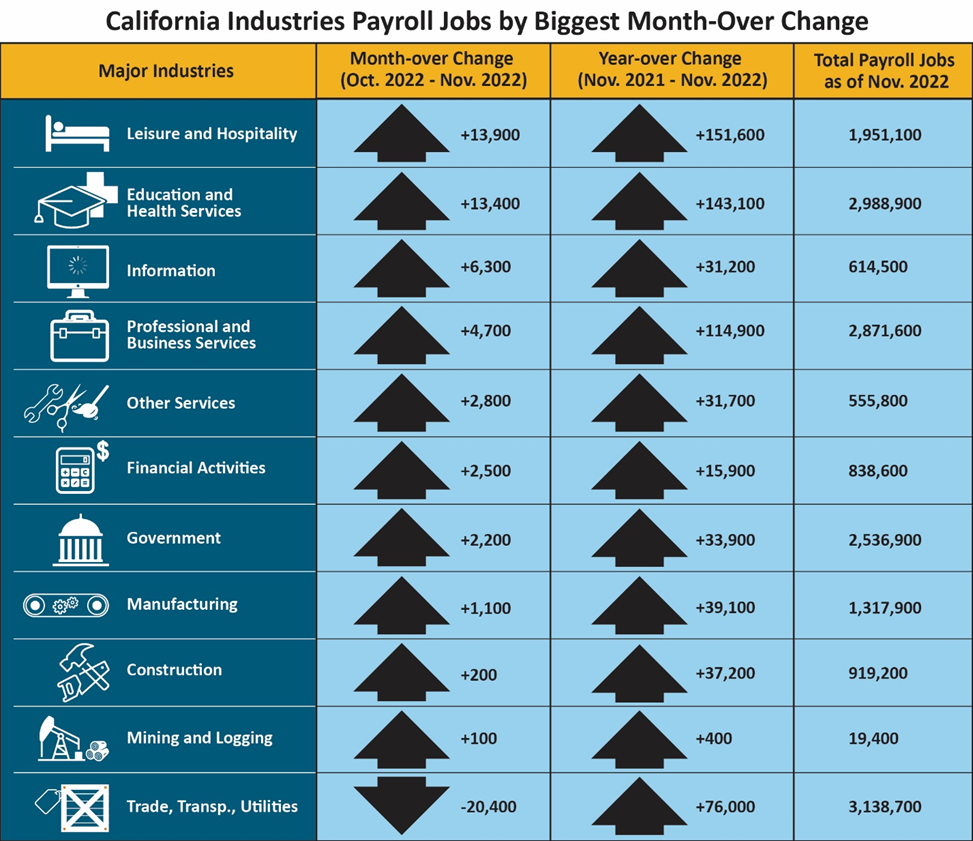
- 10 of California’s 11 industry sectors gained jobs in November with Leisure & Hospitality (+13,900) showing the largest month-over gains thanks to strength in Amusement Parks and Arcade, Other Amusement and Recreational Activities, and Limited-Service Eating Places.
- Educational & Health Services (+13,400) also enjoyed a strong month-over gain thanks, in part, to above-average hiring in Elementary and Secondary Schools, as well as Business, Technical, and Trade Schools and Educational Support Services.
- Gains in Information (+6,300) came almost entirely from growth in the Motion Picture and Video Production industry subsector.
1. The unemployment rate comes from a separate federal survey of 5,100 California households.
2. The nonfarm payroll job numbers come from a federal survey of 80,000 California businesses.
Data Trends about Jobs in the Economy
Total Nonfarm Payroll Jobs
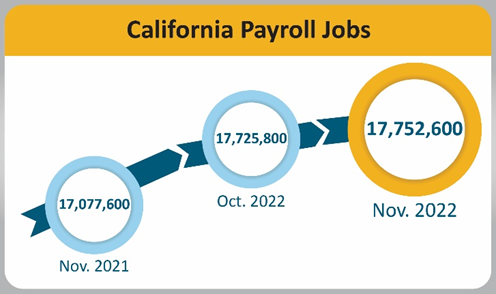
Total Nonfarm Payroll Jobs (Comes from a monthly survey of approximately 80,000 California businesses that estimates jobs in the economy – seasonally adjusted)
- Month-over – Total nonfarm jobs in California’s 11 major industries totaled 17,752,600 in November – a net gain of 26,800 jobs from October. This followed an upwards revised (+3,100) month-over gain of 59,800 jobs in October.
- Year-over – Total nonfarm jobs increased by 675,000 (a 4.0 percent increase) from November 2021 to November 2022 compared to the U.S. annual gain 4,869,000 jobs (a 3.3 percent increase).
Total Farm jobs – The number of jobs in the agriculture industry increased from October by 400 to a total of 411,100 jobs in November. The agricultural industry had 3,900 more farm jobs in November 2022 than it did in November a year ago.
Data Trends about Workers in the Economy
Employment and Unemployment in California (Based on a monthly federal survey of 5,100 California households which focuses on workers in the economy)
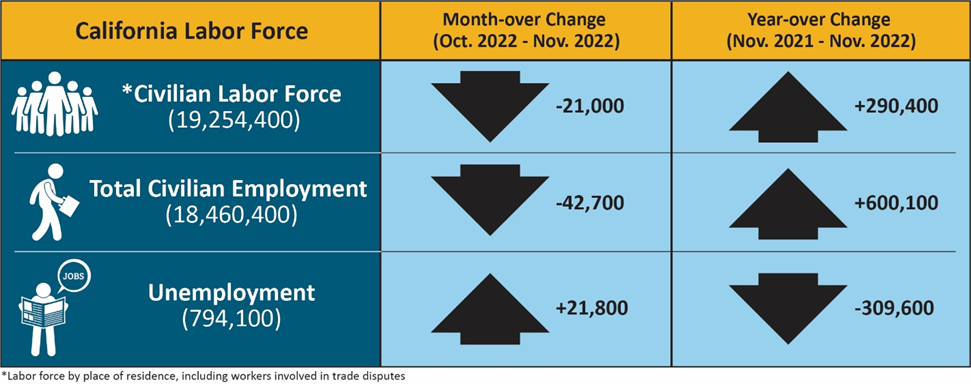
- Employed – The number of Californians employed in November was 18,460,400, a decrease of 42,700 persons from October’s total of 18,503,400, but up 600,100 from the employment total in November 2021.
- Unemployed – The number of unemployed Californians was 794,100 in November, an increase of 21,800 over the month, but down 309,600 in comparison to November 2021.
Unemployment Insurance Claims (Not Seasonally Adjusted)
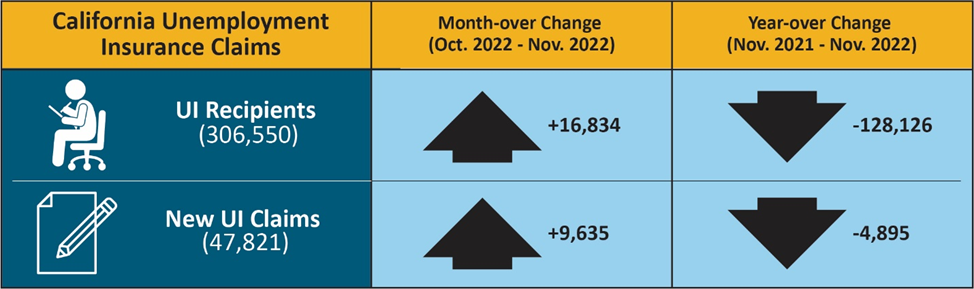
The following data is from a sample week that includes the 19th of each month:In related data that figures into the state’s unemployment rate, there were 306,550 people certifying for Unemployment Insurance benefits during the November 2022 sample week. That compares to 289,716 people in October and 434,676 people in November 2021. Concurrently, 47,821 initial claims were processed in the November 2022 sample week, which was a month-over increase of 9,635 claims from October, but a year-over decrease of 4,895 claims from November 2021.
| COUNTY | LABOR FORCE | EMPLOYMENT | UNEMPLOYMENT | RATE |
|---|---|---|---|---|
| STATE TOTAL | 19,218,400 | 18,444,600 | 773,800 | 4.0% |
| ALAMEDA | 827,200 | 801,200 | 26,000 | 3.1% |
| ALPINE | 490 | 460 | 30 | 5.3% |
| AMADOR | 14,280 | 13,640 | 640 | 4.5% |
| BUTTE | 92,900 | 88,900 | 4,000 | 4.3% |
| CALAVERAS | 21,830 | 21,070 | 750 | 3.4% |
| COLUSA | 11040 | 9,910 | 1,130 | 10.2% |
| CONTRA COSTA | 552,700 | 533,900 | 18,700 | 3.4% |
| DEL NORTE | 9,300 | 8,830 | 470 | 5.1% |
| EL DORADO | 92,500 | 89,500 | 2,900 | 3.2% |
| FRESNO | 447,700 | 418,100 | 29,600 | 6.6% |
| GLENN | 12,630 | 11,980 | 650 | 5.2% |
| HUMBOLDT | 60,900 | 58,600 | 2,200 | 3.7% |
| IMPERIAL | 70,800 | 59,000 | 11,800 | 16.7% |
| INYO | 8,260 | 7,980 | 280 | 3.3% |
| KERN | 391,500 | 365,100 | 26,400 | 6.8% |
| KINGS | 56,400 | 52,500 | 3,900 | 6.9% |
| LAKE | 28,330 | 28,850 | 1,480 | 5.2% |
| LASSEN | 9,390 | 9,020 | 370 | 3.9% |
| LOS ANGELES | 4,949,900 | 4,728,400 | 221,400 | 4.5% |
| MADERA | 61,400 | 57,500 | 3,900 | 6.3% |
| MARIN | 128,400 | 125,300 | 3,200 | 2.5% |
| MARIPOSA | 6,850 | 6,540 | 310 | 4.6% |
| MENDOCINO | 37,550 | 36,080 | 1,470 | 3.9% |
| MERCED | 116,300 | 107,900 | 8,400 | 7.2% |
| MODOC | 3,210 | 3,060 | 150 | 4.6% |
| MONO | 8,390 | 8,080 | 320 | 3.8% |
| MONTEREY | 209,400 | 197,900 | 11,500 | 5.5% |
| NAPA | 67,700 | 65,500 | 2,100 | 3.2% |
| NEVADA | 47,840 | 46,330 | 1,510 | 3.2% |
| ORANGE | 1,597,500 | 1,550,300 | 47,200 | 3.0% |
| PLACER | 192,000 | 186,500 | 5,400 | 2.8% |
| PLUMAS | 7,290 | 6,840 | 450 | 6.2% |
| RIVERSIDE | 1,170,300 | 1,120,800 | 49,500 | 4.2% |
| SACRAMENTO | 722,400 | 693,800 | 28,600 | 4.0% |
| SAN BENITO | 33,100 | 31,500 | 1,600 | 4.7% |
| SAN BERNARDINO | 1,023,600 | 981,200 | 42,400 | 4.1% |
| SAN DIEGO | 1,583,000 | 1,530,100 | 52,900 | 3.3% |
| SAN FRANCISCO | 573,900 | 560,700 | 13,200 | 2.3% |
| SAN JOAQUIN | 335,800 | 317,200 | 18,600 | 5.5% |
| SAN LUIS OBISPO | 136,100 | 132,300 | 3,800 | 2.8% |
| SAN MATEO | 454,300 | 444,500 | 9,800 | 2.2% |
| SANTA BARBARA | 225,000 | 217,900 | 7,100 | 3.2% |
| SANTA CLARA | 1,055,200 | 1,030,400 | 24,900 | 2.4% |
| SANTA CRUZ | 134,500 | 128,600 | 5,900 | 4.4% |
| SHASTA | 74,000 | 70,700 | 3,200 | 4.3% |
| SIERRA | 1,340 | 1,290 | 40 | 3.2% |
| SISKIYOU | 16,260 | 15,390 | 870 | 5.3% |
| SOLANO | 200,100 | 191,600 | 8,500 | 4.3% |
| SONOMA | 247,600 | 240,500 | 7,100 | 2.9% |
| STANISLAUS | 238,900 | 225,700 | 13,200 | 5.5% |
| SUTTER | 44,800 | 41,800 | 3,000 | 6.7% |
| TEHAMA | 25,700 | 24,510 | 1,200 | 4.7% |
| TRINITY | 4,390 | 4,180 | 210 | 4.7% |
| TULARE | 205,200 | 187,700 | 17,400 | 8.5% |
| TUOLUMNE | 19,790 | 18,940 | 850 | 4.3% |
| VENTURA | 412,600 | 397,500 | 15,100 | 3.7% |
| YOLO | 107,900 | 103,800 | 4,100 | 3.8% |
| YUBA | 30,700 | 29,000 | 1,800 | 5.7% |
Source: CA. EDD

