


January 2023 La Niña update, and the ENSO Blog investigates, part 2
January 15, 2023 - By Emily Becker - Hello from the 103rd Annual Meeting of the American Meteorological Society! Your trusty ENSO correspondent is writing to you from Denver, CO this January. (ENSO = El Niño/Southern Oscillation, the entire El Niño/La Niña system.) Today I have an overview of current conditions and the forecast, before getting back to the question I posed last month—how does ENSO affect daily temperatures during the winter? Let’s get to it, as there’s a lot of ground to cover this month!
Current events
The sea surface in the tropical Pacific has been cooler than the long-term average (1991–2020, currently) since mid-2020, and it remains so. However, we did see some weakening of this pattern over the past few weeks.
Sea surface temperatures in the tropical Pacific Ocean from mid-November 2022 through early January 2023 compared to the long-term average. East of the International Dateline (180˚), waters remained cooler than average, a sign of La Niña. Graphic by Climate.gov, based on data from NOAA’s Environmental Visualization Lab. Description of historical baseline period.
What we did not see weaken was the La Niña-like atmospheric pattern over the tropical Pacific. The atmosphere typically responds to La Niña’s cooler-than-average sea surface with a stronger-than-average Walker circulation: more rain and clouds over Indonesia than average, less over the central tropical Pacific, and stronger winds, both the near-surface, east-to-west winds, and the upper-level, west-to-east winds. In December, all these patterns were still clearly present.
We also regularly take the temperature of the subsurface tropical Pacific, as the water at depth can supply the surface. There’s been a substantial amount of cooler-than-average water under the surface since late summer, but this weakened a lot over November–December. However, the subsurface in the eastern Pacific is still relatively cool.
La Niña is still in force, then. What’s to come, you ask?
Looking ahead
Let’s get right to the punchline: there’s an 82% chance that La Niña will have ended and neutral conditions will reign by springtime (March–May). Forecasting the exact season (any three-month average is a ‘season’ in the ENSO-monitoring world) that La Niña will end (January–March? February–April?) is always challenging, since the range of potential outcomes shown in the forecast models is still substantial even just a couple months ahead. Our dynamical computer models, computer programs that use complex mathematical equations to predict how current conditions will evolve in the future, are leaning toward an earlier transition. However, the statistical models, which make predictions based on how similar conditions from past years evolved, are thinking neutral conditions will arrive a little later. The forecast team is favoring the statistical models’ outlook, in part due to that strong La Niña-like atmospheric circulation I mentioned above.
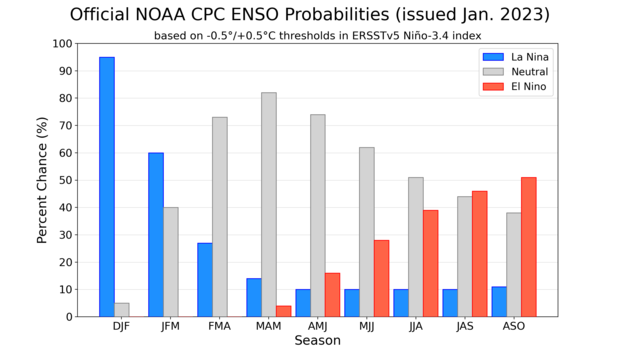
NOAA Climate Prediction Center forecast for each of the three possible ENSO categories for the next 8 overlapping 3-month seasons. Blue bars show the chances of La Niña, gray bars the chances for neutral, and red bars the chances for El Niño. Graph by Michelle L'Heureux.
You may notice those red bars lurking way over on the right of this chart. Is El Niño in store for next fall/winter??? We need to see more signs of El Niño before we would start expecting that. It’s still more than 6 months away, and the probabilities for neutral+La Niña are still pretty close to even with El Niño. Also, since ENSO is a seasonal pattern, we need to be able to expect that El Niño’s characteristic warmer-than-average tropical Pacific would be present for more than one or two months in a row. We don’t have strong physical signs right now, either, like a large amount of warmer-than-average water looming under the surface, and the Walker circulation is still amped up. Stay tuned, for sure—but for the moment, we are not issuing an El Niño Watch.
One more thing to mention this month—California is getting deluged with rain and snow right now with a series of atmospheric rivers. You may be saying “hey wait, I thought La Niña meant California and the southwest would be dry this winter!” It’s true, typical La Niña impacts include a drier-than-average southwestern U.S. and more rain and snow than average in the Pacific northwest. But ENSO only makes certain seasonal impacts more or less likely—it’s not a guarantee of a drier/colder/warmer/wetter winter. If it were a guarantee, it would make our jobs a lot easier! In fact, we have a fairly recent example of another winter that deviated from expected La Niña impacts, 2016–17.
Also, it’s currently impossible to predict short-term weather patterns months in advance. Right now, we can only say that La Niña winters tend to be drier across the southern U.S. Maybe in time we’ll have the capability to predict this type of subseasonal variability months in advance. You can bet there will be a lot of research into understanding the weather and climate drivers behind this extreme rain/snow pattern and if/how climate change factors in.
You promised me daily temperature!
Not a lot of space left in my column for an update on my little investigation into how ENSO affects daily temperature during the winter! So, I’ll just introduce the next steps and get to the details in an upcoming post.
I looked at the winter daily average temperature in December’s post, including the overall range of daily temperature and how that range looked during El Niño and La Niña separately. We found that, generally, La Niña winters had a wider range of daily temperature across much of North America, with some decreased range in the vicinity of the Hudson Bay. El Niño winters were generally opposite.
We certainly had some extreme temperature swings across a lot of the U.S. over the past few weeks—is that you, La Niña? Just like the heavy rain and snow that California is currently experiencing, we can’t take one short-term example and extend it to the entire season. (Again, we’ll learn a lot from the research that will be conducted about this recent weather.)
But the average temperature isn’t what we really notice, as we go about our daily business. We’re more likely to notice the highest and/or lowest temperature.
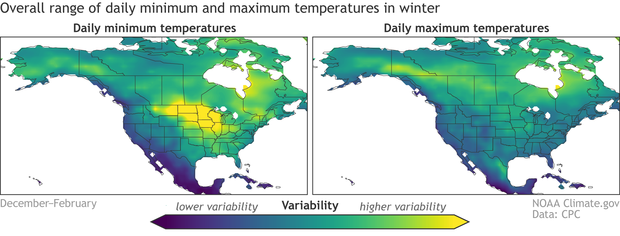
The average variability of daily low temperatures (left) and high temperatures (right) within winter. Yellow regions show where the range of daily temperatures in winter is greatest, while blue shows regions with the narrowest range. The range is assessed using the standard deviation of daily low or high temperature averaged over all winters (December–February), 1950–2020. Daily temperature data source is Berkeley Earth. Map by climate.gov based on analysis by Emily Becker.
Here, we’re looking at the range of daily low and high temperatures during December–February for all winters from 1950–2020. Overall, there is a lot more range in daily low temperatures than highs, especially in the middle of the continent. Only in the subtropical regions of North America do daily maximums vary more than minimums. Details of my analysis are in the footnote.
That’s all I have room to talk about this month! We’ll have to wait for next month to see how ENSO affects the pattern of daily maximum and minimum temperatures we see above and get into some discussion about the physical factors behind these patterns. That is, if there’s time! Thanks for conducting this science-on-installment experiment with me.
Footnote
Details on the analysis:
- The maps show the standard deviation of daily maximum or minimum temperature for each winter averaged over all winters 1950–2020.
- Daily temperature data: I used Berkeley Earth daily average temperature dataset. It’s also available here.
- Years included: 1950–2020. Berkeley Earth is available through near-present, but the data I downloaded ended in 2020. I’ll update with 2021–2022, but I don’t expect the overall results to change.
- Programming language: I used Python. Jupyter notebook available upon request.
A blog about monitoring and forecasting El Niño, La Niña, and their impacts.
Disclaimer:
The ENSO blog is written, edited, and moderated by Michelle L’Heureux (NOAA Climate Prediction Center), Emily Becker (University of Miami/CIMAS), Nat Johnson (NOAA Geophysical Fluid Dynamics Laboratory), and Tom DiLiberto and Rebecca Lindsey (contractors to NOAA Climate Program Office), with periodic guest contributors.
Ideas and explanations found in these posts should be attributed to the ENSO blog team, and not to NOAA (the agency) itself. These are blog posts, not official agency communications; if you quote from these posts or from the comments section, you should attribute the quoted material to the blogger or commenter, not to NOAA, CPC, or Climate.gov.
Source: ENSO blog team

