


California and National Drought Summary for April 11, 2023
Summary
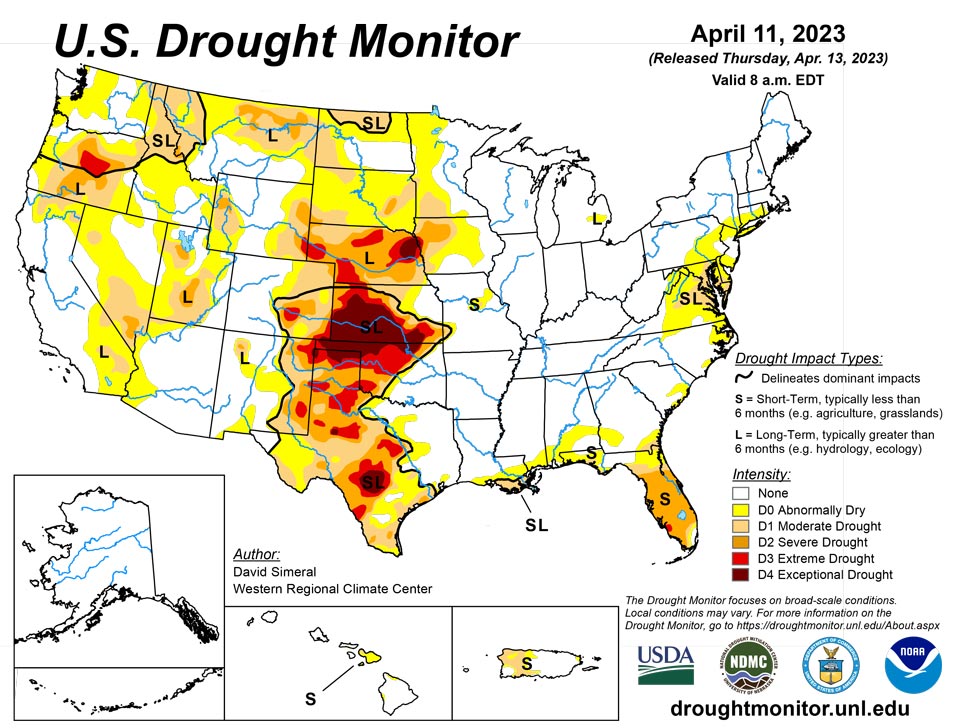
April 13, 2023 - This U.S. Drought Monitor (USDM) week saw continued improvements on the map across areas of the West including California, Nevada, Idaho, Montana, and Utah. In the Plains states, drought-related conditions degraded in the southern Plains in Kansas and Oklahoma. In Kansas, the past 9-month period (July 2022-March 2023) has been the 4th driest on record, according to the NOAA National Centers for Environmental Information (NCEI). In the northern Plains, the conditions on the map improved in response to recent significant winter storm events that helped to boost snowpack conditions in North Dakota where numerous weather stations broke all-time snow depth records for April, according to the North Dakota State Climate Office. In the South, a mix of improvements and degradation characterized the region’s drought status this week. Significant improvements were observed in South Texas, parts of the Hill Country, and the Gulf Coast regions where locally heavy rainfall accumulations (2 to 8+ inches) were logged. Conversely, areas of western Texas and the Panhandle saw continued degradations in response to short and longer-term precipitation shortfalls. In the Southeast, above-normal temperatures (4 to 8 deg. F) and generally dry conditions persisted across drought-affected areas of Florida. Further to the north in the Carolinas and areas of southern Virginia, improvements were made related to widespread shower activity, including some locally heavy accumulations (2 to 5+ inches), observed this past week. In the Mid-Atlantic and Northeast, short-term dry conditions and widespread low streamflow activity led to areas of degradation in Virginia, Maryland, New Jersey, New York, Connecticut, and Rhode Island. Looking at the latest climatological data released by NOAA NCEI, March precipitation across the contiguous U.S. ranked in the wettest third of the historical record (129 years) with well above-normal precipitation (falling in the top 10th percentile) observed regionally across much of the western U.S. including in California (7th wettest), Nevada (6th wettest), and Utah (3rd wettest). Meanwhile, drier-than-normal conditions for March were observed across much of the Eastern Seaboard including in Virginia, which saw its 8th driest on record. In terms of average temperatures, temperatures were above normal for March across all of the Eastern Seaboard as well as across the southern Gulf Coast states where Florida observed its 8th warmest on record. In the northern Plains and across the West, cooler-than-normal temperatures prevailed with notable anomalies observed in California (5th coldest), Nevada (5th coldest), Oregon (3rd coldest), and Utah (7th coldest). Looking at snowpack conditions across the West, record-breaking snowpack conditions were observed in the Sierra Nevada, Great Basin, ranges of the Colorado Plateau in Utah and northern Arizona, and in the central and southern Rockies of western Colorado, northern Utah, and southeastern Idaho.
Northeast
For the week, degradations were made on the map including in Rhode Island, Connecticut, southeastern New York, northern New Jersey, eastern Pennsylvania, and Maryland where areas of Abnormally Dry (D0) were introduced in response to short-term (past 60-day period) rainfall deficits (ranging from 1 to 4 inches), widespread low streamflow levels (<10th percentile), and declining groundwater levels in some areas. For the week, average temperatures were 2 to 5+ degrees F above normal across the southern extent of the region, while areas of New Hampshire and Maine were 1 to 3 degrees F below normal. In terms of precipitation for the week, the region was generally dry except for some light precipitation accumulations (<2 inches) observed in New England. Looking at the latest climatological rankings from NOAA NCEI, the Northeast climate region experienced its 45th driest (of 129 years) March period on record and its 32nd warmest for the same period. For the past 12-month period (April 2022-March 2023), the region saw its 3rd warmest on record in terms of average temperatures with a +3.7-degree F anomaly. For precipitation, it was the 36th wettest (+2.39-inch anomaly) for the contemporaneous period. At a state level, the past 12-month period precipitation was above normal across Maine, New Hampshire, Vermont, New York, and West Virginia with Maine having its 13th wettest April-March period on record (+7.81-inch anomaly).
Southeast
During the past week, light to moderate rainfall accumulations (ranging from 1 to 4 inches) were observed across areas of the region with the highest accumulations across the Carolinas and northern Georgia. This week’s rainfall led to minor improvements on the map in southern Florida, southern Alabama, Carolinas, and Virginia. Conversely, continued dryness and very low streamflow levels (numerous rivers and streams below the 10th percentile) led to an expansion of areas of Moderate Drought (D1) in northern Virginia where precipitation deficits ranged from 2 to 4 inches during the past 60-day period. According to NOAA NCEI’s statewide climatological rankings, the March 2023 period was the 38th driest and 22nd warmest on record for the Southeast Climate Region. For the past 12-month period (April 2022-March 2023), the region saw its 5th warmest on record with a +2.5-degree F anomaly.
South
In the South, drought-related conditions improved in areas of southern Texas in association with some locally heavy rainfall accumulations (up to 8 inches) during the past week. In other areas of the region, drought-related conditions deteriorated in isolated areas of western Oklahoma and Texas in response to precipitation shortfalls at various time scales, low streamflows (<10th percentile), poor groundwater conditions, and impacts within the agricultural sector. For the week, average temperatures across the region were below normal across Louisiana, Oklahoma, and Texas (2 to 10+ degrees F) while Arkansas, Mississippi, and Tennessee were 1 to 5 degrees F above normal. According to NOAA NCEI, the past 12-month period (April 2022-March 2023) was the 5th warmest and 33rd driest on record in the South Climate Region. For March 2023, the region saw its 35th warmest on record with a +3.0-degree F anomaly and its 51st driest on record.
Midwest
For the week, light precipitation accumulations (<2 inches) were observed across most of the region with higher totals observed in the Ohio River Valley in southern portions of Indiana and Ohio. On the map, no changes were made in the region, and drought-free conditions were present across most of the region with the exception of areas of drought in southwestern Minnesota, western Iowa, and Missouri. Average temperatures for the week were above normal (1 to 6 degrees F) across most of the region except for areas of Minnesota and northern Wisconsin where temperatures ranged from 2 to 12 degrees F below normal. According to NOAA NCEI, average temperatures were near normal across much of the region during March 2023. However, cooler-than-normal temperatures were observed in Minnesota (30th coldest, -4.0 degrees F anomaly) while Michigan was above normal (42nd warmest, +2.5 degrees F anomaly). In terms of precipitation, above-normal precipitation for March was observed in Missouri (20th wettest), Illinois (29th wettest), Wisconsin (26th wettest), Indiana (13th wettest), Ohio (37th wettest), and in Michigan (23rd wettest). For the past 6-month period (October 2022-March 2023), precipitation was above normal across areas of the region including in Missouri, Minnesota, Wisconsin, and Michigan with Minnesota logging its 7th wettest on record.
High Plains
On this week’s map, deterioration occurred in the southern extent of the region in Kansas where both short and long-term precipitation deficits exist (ranging from 4 to 16 inches during the past 12-month period). Moreover, other drought-related indicators, such as surface and root zone soil moisture, are showing very low moisture levels (ranging from the 2nd to the 20th percentile) across Kansas as well as much of Nebraska, according to NASA Short-term Prediction Research and Transition Center (NASA SPoRT). In the Dakotas, deep snowpack conditions were observed this month as well as recent rapid melting which has boosted soil moisture levels significantly (leading to improvement on the map) as well as concerns over major flooding. Flood warnings have been issued for numerous rivers across the Dakotas as temperatures are expected to soar into the low 90s today (April 12) in southeastern South Dakota. According to NOAA NCEI, North Dakota logged its 32nd wettest March on record while Nebraska observed its 28th driest and Kansas its 14th driest. In terms of average temperatures, North Dakota observed its 5th coldest March and South Dakota its 16th coldest on record, For the 12-month period (April 2022-March 2023), Nebraska experienced its 11th driest on record while Kansas its 17th driest.
West
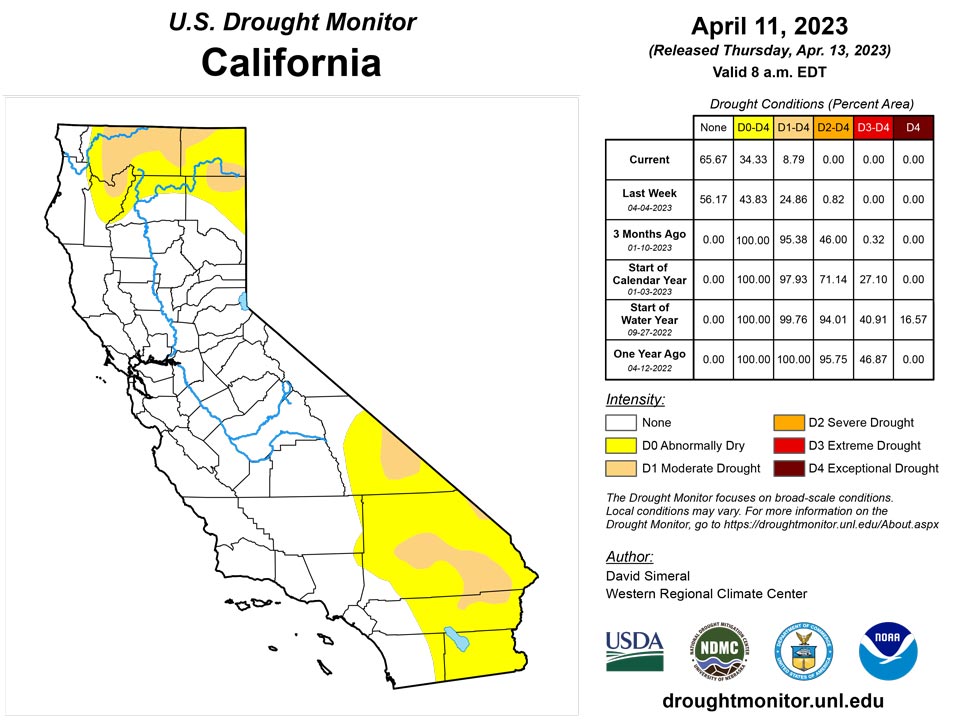
On the map, another round of improvements was made in drought-affected areas of California, Nevada, Idaho, Montana, and Utah this week. Looking at the October through March period, NOAA NCEI’s latest climatological rankings are showing above-normal precipitation in the West Climate Region (California, Nevada) as well as in the Southwest Climate Region (Four Corners states) coming in at 9th wettest (+6.31-inch anomaly) and 18th wettest (+1.83-inch anomaly), respectively. At a statewide level for the contemporaneous period, California ranked 10th wettest (+8.6 inch-anomaly), Nevada 5th wettest (+3.03-inch anomaly), and Utah 4th wettest (+3.71-inch anomaly). Looking at the latest region-level (2-digit HUC) snowpack data across the West, the NRCS SNOTEL network (April 11) was reporting the following median snow water equivalent (SWE) levels: Pacific Northwest 126%, Missouri 114%, Souris-Red-Rainy 84%, California 258%, Great Basin 246%, Upper Colorado 157%, Arkansas-White-Red 98%, Lower Colorado 417%, and Rio Grande 143%. In the Colorado River Basin, Lake Powell was at 23% of capacity and Lake Mead at 28% of capacity on April 11, according to the U.S. Bureau of Reclamation. In Arizona, the Salt and Verde River system reservoirs were 98% full as compared to 72% full a year ago, according to the Salt River Project. In California, the state’s two largest reservoirs, Shasta Lake and Lake Oroville, are 110% and 117% of their historic averages for the date, respectively. Overall, drought coverage (D1-D4 categories) in California on the map dropped to 8.79% this week as compared to 99.77% at the beginning of the Water Year (October 1, 2022). Likewise, drought coverage on the map in Utah went from 100% (October 1) to 35% this week, and in Nevada from 100% (October 1) to 23%.
Caribbean
In Puerto Rico, areas of locally heavy rainfall (ranging from 2 to 10+ inches) led to the removal of areas of Moderate Drought (D1) in eastern Puerto Rico.
Most of the U.S. Virgin Islands have remained drier than normal. Reports from NOAA indicated that vegetation is beginning to show signs of distress due to the drier-than-normal conditions. For example, poultry farmers across the islands are reporting a decrease in egg production due to heat. Because of the recent rains, some improvements across the islands have been observed on the short-term SPI maps. However, the drier-than-normal conditions remain at the 1- and 3-month SPI maps across the three islands. The satellite data (i.e., National Weather Service’s seven-day quantitative precipitation estimates) and station observations show that the rainfall amount received over most parts of the islands was less than 1 inch.
St. John (Rafe Boulon/Windswept Beach) reported 0.87 inches of rain this week. The depth to water level at Susannaberg DPW 3 well (St. John, USVI) on April 11 was 14.54 ft below land surface, increasing the depth as compared to last week. Thus, St. John remains at the status quo of abnormally dry condition.
On St. Thomas (Cyril E. King Airport), 0.50 inches of rain was reported this week. The depth to water level Grade School 3 well (St. Thomas, USVI) on April 11 was 12.78 ft below land surface with an increasing trend continuing this week. Thus, St. Thomas remained in short-term moderate drought (D1-S).
St. Croix (Henry Rohlsen AP) reported 0.30 inches of rain this week. The depth to water level at Adventure 28 Well (St. Croix, USVI) on April 11 was 29.53 ft below land surface. This indicates an increasing trend in depth of water at St. Croix. If continued, recent rains could ameliorate the drought condition. However, St. Croix remains in long-term severe drought for this week.
Pacific
In Alaska, no changes were made on the map this week and the state remained drought-free. According to the NRCS SNOTEL network, sub-region level (4-digit HUC) water-year-to-date precipitation (percent of median) is as follows: Arctic Alaska (112%), Northwest Alaska (120%), Lower Yukon River (125%), Middle Yukon River (132%), Upper Yukon (156%), South Central Alaska (90%), and Southeast Alaska (112%).
For the Hawaiian Islands, no changes were made on the map this week and the state remained primarily drought-free except for a small area of Moderate Drought (D1) in Maui.
This week, heavy rainfall was observed across the Marshall Islands, including 7.49 inches of rain on Ailinglapalap. However, little or no rain was reported on Wotje. On Jaluit, only 1.88 inches of rain was observed this week, allowing the island to remain in abnormally dry condition. Kwajalein and Wotje received 0.01 and 0.63 inches of rain this week, respectively. Thus, due to the drier-than-normal conditions, Kwajalein and Wotje remained in short-term moderate drought and severe drought conditions, respectively. On Majuro, 0.91 inches of rain was reported. However, due to heavy rains on Majuro in recent weeks, the island remained free of drought. On Mili, 2.93 inches of rain, with one day missing, was reported this week, allowing the island to be drought free. No depiction was made for Utirik due to missing data.
This week, wet conditions have continued across the Mariana Islands. Rainfall amounts on Guam and Rota were 2.72 and 2.21 inches (one day missing), respectively. Despite 3.39 inches of rainfall last week, 0.49 inches of rain was reported on Saipan (IAP, manual gauge) with one day missing. Thus, Saipan remains drought free this week.
Because of the wet conditions in the past few weeks, American Samoa remained free of drought. This week, Pago Pago received 0.77 inches of rain.
Palau IAP (Airai) reported 0.37 inches this week. Koror COOP station also reported 1.57 inches of rain, allowing the island to be drought free.
Most parts of the Federated States of Micronesia remained drought free. This week, 5.55 inches of rain was reported on Kapingamarangi with two days missing. In addition, Kapingamarangi had significant rains in the past three weeks, improving the island to be drought free. On Kosrae, 4.28 inches of rain was reported this week (with one day missing). Because of the wet conditions in the past few months, Kosrae remained drought free. On Lukunor, only 2.77 inches of rainfall was reported this week (with four days missing), allowing the island to remain drought free. On Nukuoro, 10.27 inches of rain was reported this week (one day missing), allowing the island to be free of drought. Pingelap reported 4.30 inches of rain with one day missing and remained free of drought. On Yap, 2.93 inches of rain (three days missing) was reported this week, and the island remained free of dryness. Fananu reported 7.35 inches of rain and was drought free. On Woleai, 2.49 inches of rain was reported this week (four days missing), so it remains drought free. Heavy rain (5.22 inches with one day missing) was reported on Pohnpei, so the island remained free of dryness. On Chuuk, 5.45 inches of rain was reported this week with one day unaccounted for, allowing the island to be free of dryness. In contrast, only 1.07 inches of rain was reported this week (3 days missing) on Ulithi. Despite a wet January, rainfall amounts in February and March were below normal across the island. In addition, on Ulithi, this is the third week with less than 2 inches of weekly rain reported. Local experts also reported that it is drier than normal. Thus, Ulithi is degraded to abnormally dry this week.
Looking Ahead
The NWS WPC 7-Day Quantitative Precipitation Forecast (QPF) calls for moderate-to-heavy liquid (liquid = rain + SWE) precipitation accumulations ranging from 2 to 5+ inches across western portions of Oregon and Washington while lighter accumulations (< 1 inch) are forecasted for areas of the northern and central Rockies. The remainder of the West is expected to be generally dry during the next 7-day period. In areas of the Upper Midwest and Northeast, light accumulations (< 1 inch) are expected, while light to moderate accumulations (1 to 4+ inches) are forecasted for areas of the Gulf Coast states with the heaviest accumulations expected in southern portions of Louisiana and Mississippi. The CPC 6-10-day Outlooks calls for a moderate-to-high probability of above-normal temperatures across the southern and central Plains, South, Southeast, and the Northeast, while below-normal temperatures are expected across areas west of the Rockies and across areas of the northern Plains and Upper Midwest. In terms of precipitation, below-normal precipitation is expected across the far eastern extent of the Midwest and the southwestern portion of the Northeast region, while above-normal precipitation is forecasted for Plains states, Texas, and the northern two-thirds of the western U.S.
Author(s):
David Simeral, Western Regional Climate Center
Tsegaye Tadesse, National Drought Mitigation Center
Dryness Categories
D0 Abnormally Dry—used for areas showing dryness but not yet in drought, or for areas recovering from drought.
Drought Intensity Categories
D1 Moderate Drought
D2 Severe Drought
D3 Extreme Drought
D4 Exceptional Drought
Drought or Dryness Types
S Short-term, typically less than 6 months (agriculture, grasslands)
L Long-term, typically more than 6 months (hydrology, ecology)
SL Area contains both short- and long-term impacts
Source: National Drought Mitigation Center

