


IMPORTANT NOTE: The employment data for the month of March 2023 is taken from the survey week including March 12th. Data for the month of April is scheduled for release on May 19, 2023.
Employers added 8,700 nonfarm payroll jobs
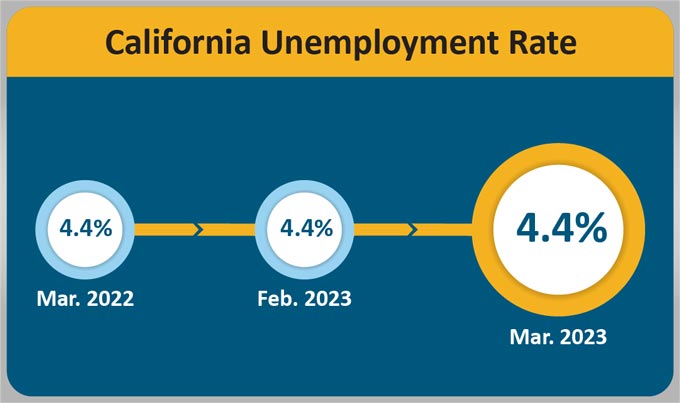
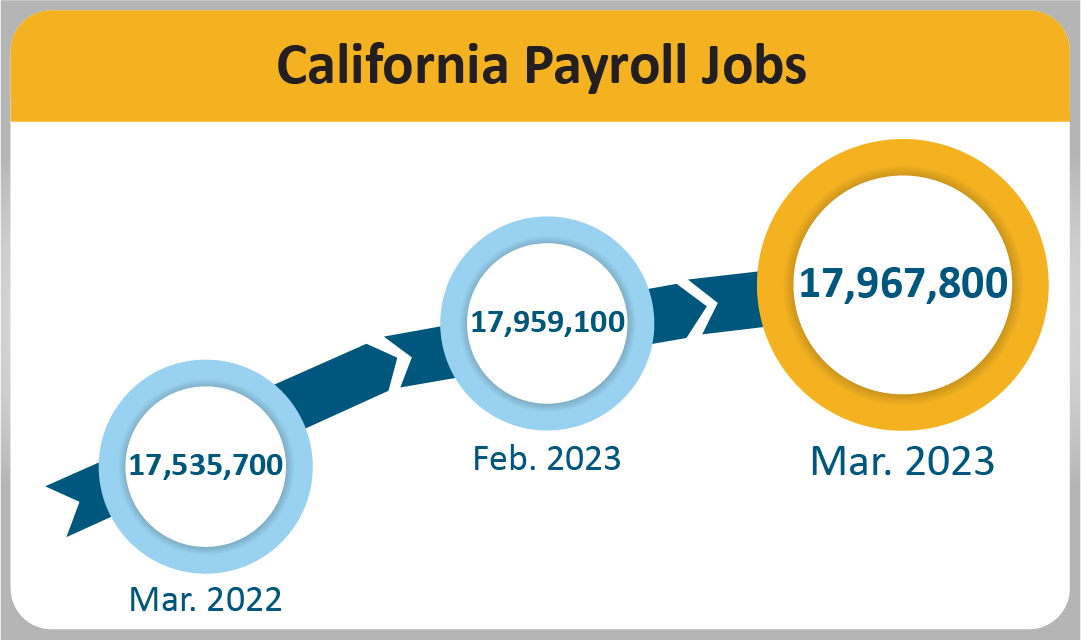
April 22, 2023 - SACRAMENTO – California’s unemployment rate stayed constant from February 2023 and remained at 4.4 percent1 for March 2023 as the state’s employers added 8,700 nonfarm payroll jobs2 to the economy, according to data released today by the California Employment Development Department (EDD) from two surveys. February 2023’s initial estimate of a 4.3 percent unemployment rate was revised up by a tenth of a percentage point due to an increase in unemployment.
California's Labor Market, by the Numbers...
- Since the current economic expansion began in April 2020, California has gained 3,049,800 jobs, which works out to a monthly average of 84,717 jobs gained over that time.
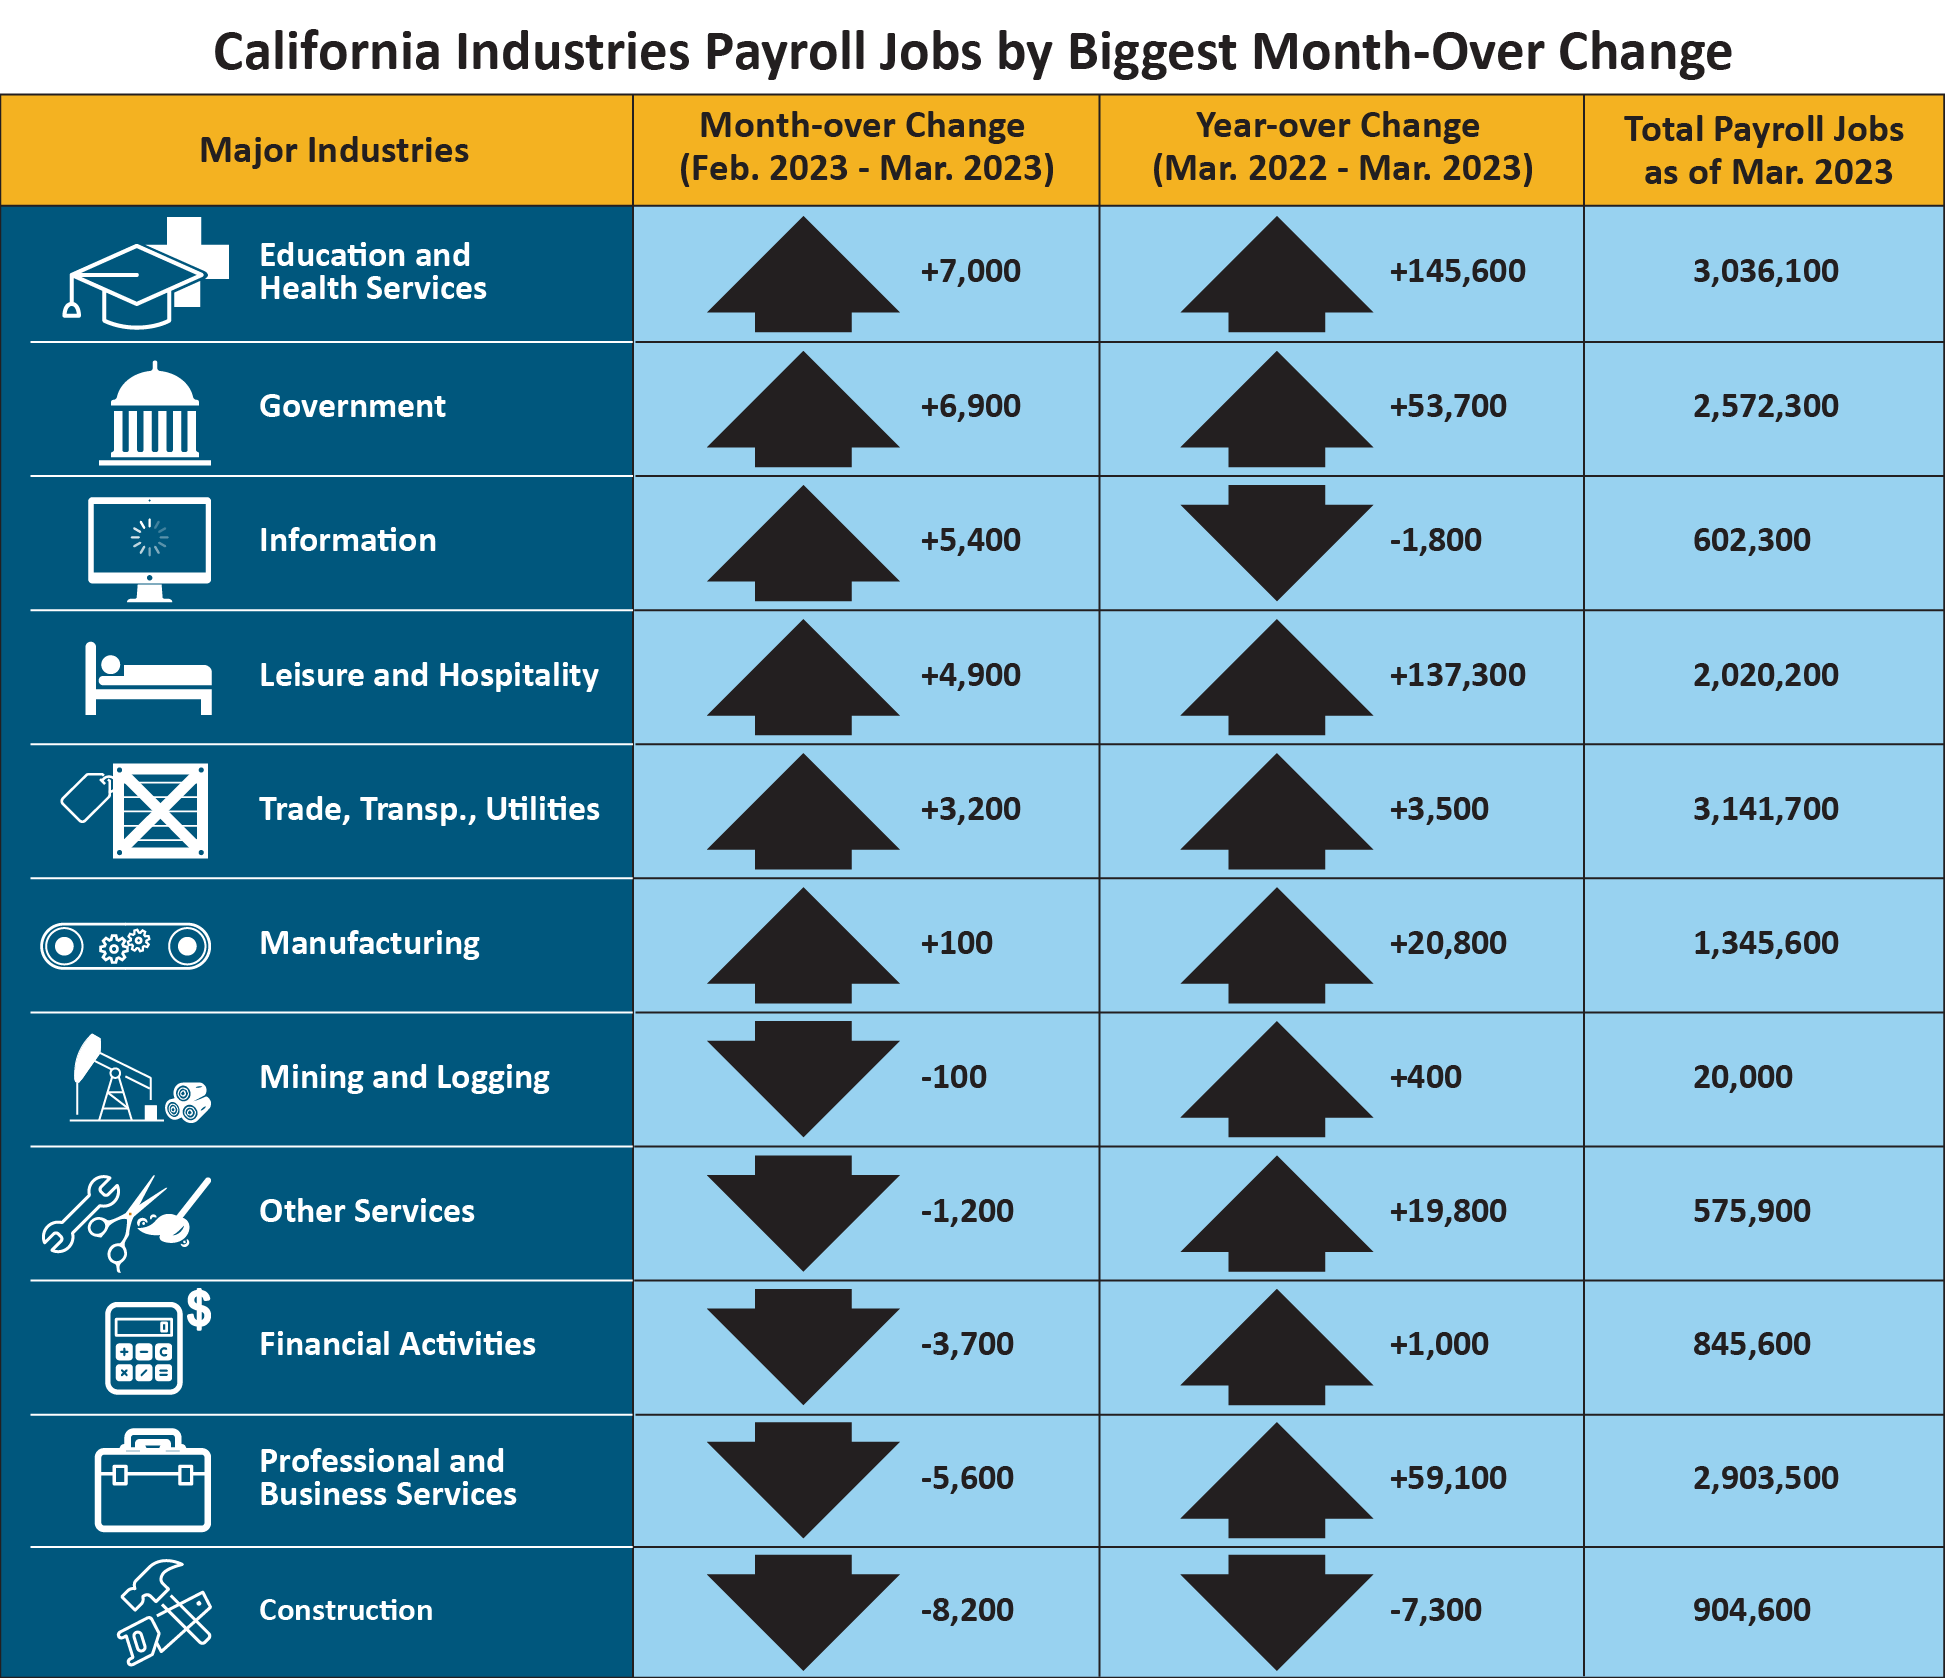
- Six of California’s 11 industry sectors gained jobs in March with Private Education and Health Services (+7,000) leading the way with notable gains in Offices of Dentists, Home Health Care Services, and Hospitals.
- Government (+6,900) enjoyed the second-strongest month-over gain as jobs were added in all three of its subsectors with the strongest gains coming in Local Government Education.
- Construction (-8,200) suffered the largest reduction in month-over employment with much of its losses coming in the Specialty Trade Contractors and Construction of Buildings subsectors. Additional losses came in the Highway, Street, and Bridge Construction and Residential Building Construction, among others. Extreme weather and flooding likely played a role in the sector’s month-over decline as atmospheric rivers hit California during the survey week.
1. The unemployment rate comes from a separate federal survey of 5,100 California households.
2. The nonfarm payroll job numbers come from a federal survey of 80,000 California businesses.
Data Trends about Jobs in the Economy
Total Nonfarm Payroll Jobs
Total Nonfarm Payroll Jobs (Comes from a monthly survey of approximately 80,000 California businesses that estimates jobs in the economy – seasonally adjusted)
- Month-over – Total nonfarm jobs in California’s 11 major industries totaled 17,967,800 in March – a net gain of 8,700 from February. This followed a downward revised (-10,500) month-over gain of 21,800 jobs in February.
- Year-over – Total nonfarm jobs increased by 432,100 (a 2.5 percent increase) from March 2022 to March 2023 compared to the U.S. annual gain 4,145,000 jobs (a 2.7 percent increase).
Total Farm jobs – The number of jobs in the agriculture industry increased from February by 10,500 a total of 434,900 jobs in March. The agricultural industry had 17,000 more farm jobs in March 2023 than it did in March a year ago.
Data Trends about Workers in the Economy
Employment and Unemployment in California (Based on a monthly federal survey of 5,100 California households which focuses on workers in the economy)
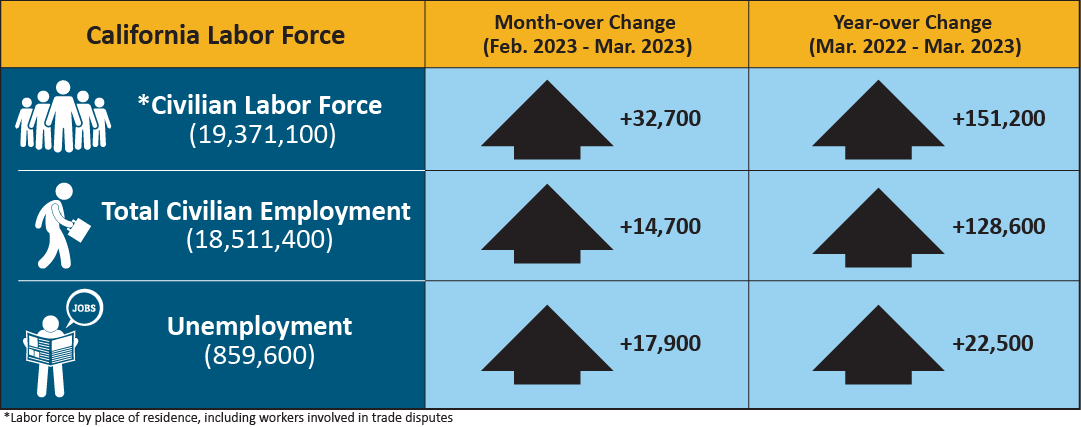
- Employed – The number of Californians employed in March was 18,511,400, an increase of 14,700 persons from February’s total of 18,496,700 and also up 128,600 from the employment total in March
- Unemployed – The number of unemployed Californians was 859,600 in March, an increase of 17,900 over the month and also up 22,500 in comparison to March 2022.
Unemployment Insurance Claims (Not Seasonally Adjusted)
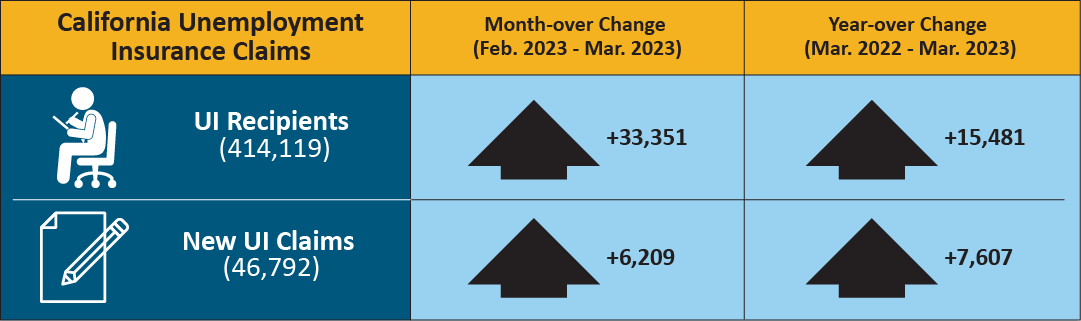
The following data is from a sample week that includes the 19th of each month: In related data that figures into the state’s unemployment rate, there were 414,119 people certifying for Unemployment Insurance benefits during the March 2023 sample week. That compares to 380,768 people in February and 398,638 people in March 2022. Concurrently, 46,792 initial claims were processed in the March 2023 sample week, which was a month-over increase of 6,209 claims from February and also a year-over increase of 7,607 claims from March 2022.
| COUNTY | LABOR FORCE | EMPLOYMENT | UNEMPLOYMENT | RATE |
|---|---|---|---|---|
| STATE TOTAL | 19,498,300 | 18,560,500 | 937,800 | 4.8% |
| ALAMEDA | 832,900 | 801,500 | 31,400 | 3.8% |
| ALPINE | 620 | 590 | 30 | 5.3% |
| AMADOR | 14,580 | 13,740 | 840 | 5.8% |
| BUTTE | 94,100 | 88,800 | 5,300 | 5.7% |
| CALAVERAS | 22,510 | 21,470 | 1,040 | 4.6% |
| COLUSA | 10,700 | 8,650 | 2,050 | 19.2% |
| CONTRA COSTA | 555,900 | 533,900 | 22,100 | 4.0% |
| DEL NORTE | 9,390 | 8,830 | 550 | 5.9% |
| EL DORADO | 94,700 | 90,900 | 3,900 | 4.1% |
| FRESNO | 467,000 | 427,000 | 40,100 | 8.6% |
| GLENN | 13,040 | 12,120 | 920 | 7.1% |
| HUMBOLDT | 60,500 | 57,600 | 2,800 | 4.7% |
| IMPERIAL | 71,400 | 60,300 | 11,100 | 15.6% |
| INYO | 8,380 | 8,060 | 320 | 3.9% |
| KERN | 392,300 | 354,700 | 37,600 | 9.6% |
| KINGS | 58,500 | 52,800 | 5,700 | 9.7% |
| LAKE | 29,000 | 27,170 | 1,830 | 6.3% |
| LASSEN | 8,990 | 8,430 | 560 | 6.2% |
| LOS ANGELES | 5,034,100 | 4,783,000 | 251,100 | 5.0% |
| MADERA | 65,700 | 60,000 | 5,700 | 8.7% |
| MARIN | 132,000 | 127,900 | 4,100 | 3.1% |
| MARIPOSA | 7,330 | 6,830 | 490 | 6.7% |
| MENDOCINO | 37,620 | 35,620 | 1,990 | 5.3% |
| MERCED | 118,100 | 104,800 | 13,200 | 11.2% |
| MODOC | 3,190 | 2,900 | 290 | 9.0% |
| MONO | 8,900 | 8,550 | 350 | 3.9% |
| MONTEREY | 225,300 | 203,600 | 21,700 | 9.6% |
| NAPA | 72,200 | 69,600 | 2,600 | 3.6% |
| NEVADA | 48,760 | 46,730 | 2,040 | 4.2% |
| ORANGE | 1,609,900 | 1,555,400 | 54,500 | 3.4% |
| PLACER | 196,600 | 189,300 | 7,300 | 3.7% |
| PLUMAS | 7,220 | 6,410 | 810 | 11.2% |
| RIVERSIDE | 1,158,900 | 1,106,000 | 53,000 | 4.6% |
| SACRAMENTO | 738,800 | 705,300 | 33,500 | 4.5% |
| SAN BENITO | 33,300 | 31,100 | 2,200 | 6.7% |
| SAN BERNARDINO | 1,014,700 | 968,900 | 45,800 | 4.5% |
| SAN DIEGO | 1,620,200 | 1,560,800 | 59,400 | 3.7% |
| SAN FRANCISCO | 581,300 | 564,100 | 17,200 | 3.0% |
| SAN JOAQUIN | 351,200 | 327,900 | 23,300 | 6.6% |
| SAN LUIS OBISPO | 140,700 | 135,900 | 4,800 | 3.4% |
| SAN MATEO | 459,900 | 447,100 | 12,700 | 2.8% |
| SANTA BARBARA | 226,000 | 215,800 | 10,200 | 4.5% |
| SANTA CLARA | 1,059,800 | 1,026,200 | 33,500 | 3.2% |
| SANTA CRUZ | 135,600 | 126,200 | 9,400 | 6.9% |
| SHASTA | 74,500 | 70,100 | 4,400 | 5.9% |
| SIERRA | 1,290 | 1,210 | 80 | 6.5% |
| SISKIYOU | 16,690 | 15,380 | 1,320 | 7.9% |
| SOLANO | 203,800 | 194,000 | 9,800 | 4.8% |
| SONOMA | 251,700 | 242,700 | 9,000 | 3.6% |
| STANISLAUS | 245,800 | 228,800 | 17,000 | 6.9% |
| SUTTER | 47,500 | 43,000 | 4,500 | 9.6% |
| TEHAMA | 25,880 | 24,150 | 1,730 | 6.7% |
| TRINITY | 4,470 | 4,150 | 320 | 7.2% |
| TULARE | 212,400 | 188,400 | 23,900 | 11.3% |
| TUOLUMNE | 20,040 | 18,920 | 1,120 | 5.6% |
| VENTURA | 418,900 | 402,000 | 16,900 | 4.0% |
| YOLO | 110,900 | 105,200 | 5,700 | 5.1% |
| YUBA | 32,600 | 30,100 | 2,500 | 7.7% |
Source: CA. EDD

