


California and National Drought Summary for March 1, 2016
Summary
Early in the period, a strong storm system tracked from the western Gulf Coast northeastward into interior New England, triggering numerous and widespread showers and thunderstorms across most of the eastern third of the Nation. Some of the storms produced severe weather that included numerous reports of tornadoes, some with fatalities, in the Southeast (February 23) and the mid-Atlantic (February 24). As the system traversed the Northeast, moderate to heavy (more than 2 inches) rain fell on most locations as temperatures were well above freezing. In the central Great Lakes region, however, colder air allowed snow to fall, with up to 15 inches measured in northwestern Indiana. As the storm exited the U.S., colder and drier weather enveloped the East. Elsewhere, after a dry start, weak Pacific systems brought light precipitation to the Northwest during the last 4 days of the period, eventually spreading eastward into the Midwest and south-central Great Plains by week’s end. Unfortunately, precipitation bypassed most of the southwestern quarter of the lower 48 States and northern Plains, and weekly temperatures averaged above normal in the West and across the northern half of the Nation. The El Nino induced dryness across Hawaii has started producing negative impacts as parts of the islands were degraded.Northeast
In addition to the early-week severe weather experienced across the mid-Atlantic, moderate to heavy rains soaked much of New England. In the mid-Atlantic and southern New England, the ground was mostly thawed, allowing the rain to penetrate into the soil. In northern and interior New England where there was more snow and frozen soils, most of the rain ran off, producing much above average (more than 90th percentile) stream flows. With 30-day precipitation at least 150% of normal, much above normal USGS average stream flows at 1, 7, 14, and 28-day, and no drought impacts, a one-category improvement was made in New England. This left a small area of D0 (formerly D1) in northern Connecticut, central Massachusetts, and southeast New Hampshire where long-term deficits (2-4 inches at 6-months, 4-8 inches at 12-months) lingered.In contrast, significant rains missed portions of the central Appalachians (south-central Pennsylvania, western Maryland, east-central West Virginia) where less than 0.5 inches fell. 90-day precipitation was about 75% of normal, creating deficiencies of 2-4 inches. Therefore the small D0 was left, and was slightly expanded southward to encompass similar 90-day shortages.
Southeast
In addition to the Feb. 23 severe weather, continued widespread rains across most of the Southeast during the past several months has left the region drought free, with only a small D0 area in southern Georgia. Unfortunately, this week’s decent rains missed southeastern Georgia and parts of north-central Florida, with 90- and 180-day precipitation now between 50-75% of normal with accumulated deficits of 2-4 and 5-10 inches, respectively. The small D0 area was enlarged southward into north-central Florida and slightly northeastward in Georgia to account for similar conditions. Fortunately, there were no known impacts from this short-term dryness, with all USGS average stream flows in the normal range.Lower Mississippi Valley (Delta)
The largest weekly precipitation totals (1-3 inches, locally up to 4.5 inches) fell on western and northern Arkansas, southeastern Louisiana, and southern Mississippi (plus severe weather in the latter two regions), and bypassed southeastern Arkansas, northern and south-central Louisiana, and central Mississippi (0.25-1 inch). As a result, 60- and 90-day shortages have accumulated across northern Louisiana and southeastern Arkansas, and throughout south-central Louisiana, resulting in deficiencies of 3-6 and 4-8 inches, respectively. With USGS 1- and 28-day average stream flows ending March 1 below normal (10-24th percentile), D0 was increased to reflect the growing short-term dryness. The abnormal dryness also extended into eastern Texas (see Southern Plains).Southern Plains
After last week’s welcome rains and improvements to short-term dryness and drought in Texas, lingering precipitation from the departing storm system early in the week (12Z Tue-12Z Wed) brought another 0.5-2 inches of rain to northern, eastern, and southeastern Texas, and southeastern Oklahoma, while the Texas Panhandle received 0.1-0.3 inches. Then late in the week (12Z Mon-12Z Tue), eastern Oklahoma recorded another 0.5-2 inches of rain. Accordingly, in Texas, some D0 was removed in the north-central Panhandle, northern (along Red River), and southeastern (near Houston) portions. D0 was also removed in eastern Kenedy and Willacy counties as leftover soil moisture from the October deluges plus the lack of persistent lower humidity days away from the coast has kept these two South Texas counties from degrading.In contrast, mostly dry weather covered the rest of Texas (southwest, south-central, and far south) and Oklahoma (Panhandle and northwest). Where little or no rain fell this week in Texas, D0 persisted and slightly expanded in extreme southwestern, far southern, east-central (going into northwestern Louisiana), and far northeastern Panhandle (continuing into north-central Oklahoma), while D1 expanded into Nueces County. Although surplus precipitation has fallen since the start of the Water Year (Oct. 1) in much of Texas and Oklahoma, recent short-term (60- and 90-days) dryness, unseasonable warmth, and strong winds have created numerous wild fires (including a 17,000 acre fire in Harper County, OK, on Feb. 18 when Buffalo hit 91F). In addition, the unseasonable warmth caused the winter wheat crop in Cimarron County, OK to break dormancy early, thus producing some stress to the crop due to inadequate topsoil moisture. Therefore, a new D0 area was added in the Oklahoma Panhandle, southeastern Colorado, and southwestern Kansas.
Central and Northern Plains
From South Dakota into Kansas, little or no precipitation fell, except for a band of precipitation (0.2-0.5 inches) in southeastern Montana, central South Dakota, southern Minnesota, northern Iowa, and southern Wisconsin. Recent surplus precipitation, however, over the past several months was enough to keep this region drought free with the exception of a few small lingering D0 areas. A watchful eye, however, will be necessary from northeastern Oklahoma northeastward into northwestern Illinois as short-term (2-months) dryness has so far been offset by very wet conditions at 3-months and longer. For example, as of March 1, Kansas City, MO had 28 consecutive days without measurable precipitation, the longest stretch since 41 days in 2002; however, Nov. 1-Dec. 31, 2015 precipitation totaled 7.67 inches, or more than twice of normal (208%).In southwestern North Dakota, recent dryness at 60- and 90-days, along with unseasonably mild readings and minimal snow cover (mainly due to melt, sublimation, and evaporation), created similar conditions that justified the merging the two D0 areas in southeastern Montana and central North Dakota. In southeastern Montana, however, re-evaluation of the tools pointed to wet conditions out to 4 months, thus the D1(S) was removed there.
Rockies, Intermountain West, and Southwest
In the northern Rockies, light to moderate (0.5-1.5 inches) amounts fell, but the central and southern Rockies saw little or no precipitation as temperatures averaged above normal. The Water Year To Date (WYTD; since Oct. 1) basin average precipitation in the Rockies was close to or above normal, with most basins between 90-110%. The lowest values were found in Wyoming (between 60-95%). Basin average Snow Water Content (SWC) on March 1 in the Rockies was also close to normal in most basins, with Wyoming coming in again at the lower end (64-99%). Based upon information from Canada regarding southern British Columbia winter precipitation and drought conditions (none), northwestern Montana was re-evaluated and determined to be wetter than depicted. Accordingly, the western and northern D2 area was shrunk (improved), and the D1 area shifted southward away from the U.S.-Canadian border. Short-term tools were wet (out to 6-months), but 9- to 12-month indices were quite dry. In contrast, recent dryness and warmth in the north-central Rockies and High Plains called for expansion of the D0 and D1 into south-central Montana (while D1 was removed from southeastern Montana – see Central and Northern Plains), and for some D1 and D2 increases in central Wyoming due to recent dryness, warmth, and minimal SWC. Surprisingly, percent of average reservoir storage was close to or above normal as of Feb. 29 at most locations in the northern and central Rockies. No changes were made in the central Rockies and Intermountain West.In the Southwest, the WYTD basin average precipitation was a mixed bag, with above-normal totals in central Arizona and New Mexico, but below-normal amounts in southern California and southwestern Arizona. March 1 average basin SWC was also mixed, with central Arizona and western New Mexico ranging between 4-45%, but northern New Mexico from 80-121%. With recent precipitation below normal in southern California, Arizona, and western New Mexico, December-February climatologically wet in western sections, and low SWC in Southwest basins, D0 was expanded across most of Arizona and western New Mexico, D1 slightly increased around the Yuma, AZ area, and D2 edged into California’s eastern Imperial Valley. With much of this area semi-arid and irrigated, impacts were difficult to determine. The Impact lines were also redrawn to depict the short-term, long-term, and both types of drought.
The Far West
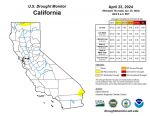
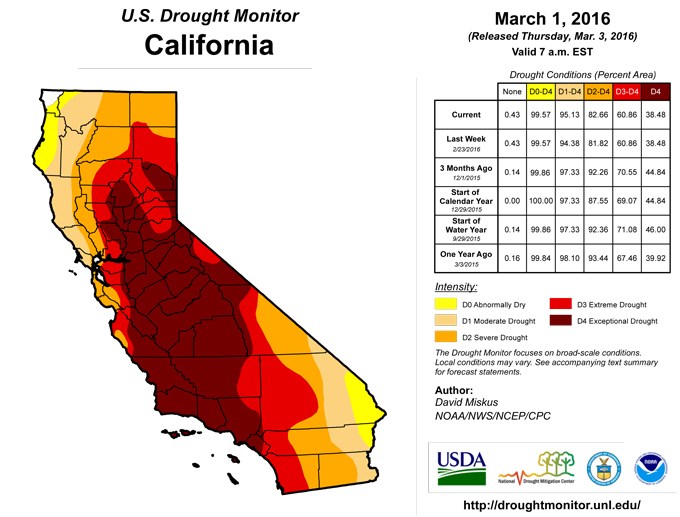
With only weak Pacific storm systems entering the Northwest, moderate precipitation (2-4 inches) was limited to coastal Washington, parts of coastal Oregon, and the central Cascades. Lighter amounts fell on interior sections of Washington and Oregon and northwestern California. WYTD average basin precipitation continued near to above normal in Washington, Oregon, northern Nevada, and California’s Sierra Nevada, but March 1 average basin SWC declined from earlier values in Washington and Oregon, now ranging between 80-119%. However, central Oregon conditions continued to improve with decent snows and good inflows into reservoirs, hence D1 was trimmed a bit. Elsewhere, with conditions better than a year ago but nothing extraordinary about this week, status-quo was the story for Washington, Idaho, Nevada, and the rest of Oregon.In northern and central California, after experiencing decent December and January precipitation and mountain snows, February (normally a wet month) was rather disappointing. The Feb. 1 average snow water equivalent (SWE) for the northern, central, and southern Sierras (23, 22, and 17 inches) was 120, 117, and 105% of normal, respectively. By March 1, the SWEs in all 3 basins were still the same as Feb. 1, but the percent of normal had declined to 89, 85, and 75%, respectively, as the SWEs should have increasing during February but instead remained static. The peak SWEs in the Sierra normally occurs on April 1, so there is still March left to build the snow pack. Even with the subnormal February precipitation, reservoirs were mostly stable as there was some carryover from high January flows and low elevation February snowmelt that kept inflows from being exceptionally low. On Feb. 24, with decent December and January precipitation, the California Department of Water Resources increased the allocation of 2016 State Water Project water for the long-term contractors from 631,115 acre-feet to 1,268,724 acre-feet, or 30% of the requested allocation, an increase from 15% earlier this year. However, recipients were warned that continued dry weather could force an allocation reduction. Except for the minor changes (1-cat deterioration) in extreme southeastern California, the rest of the state was unchanged.
Alaska, Hawaii, and Puerto Rico
In Alaska, no changes were made, although the winter (D15JF16) precipitation and temperature anomalies were much below and much above normal, respectively. Fairbanks observed their lowest precipitation (0.13 inches) and snow (2.5 inches) on record (105 years), with the second lowest at Denali National Park (94 years). But due to a very snowy November, snowpack is in better shape overall than last year at this time, except near sea-level South Central and southwestern Alaska.In Puerto Rico, after the past week’s unseasonably heavy rains and widespread improvements, rainfall was much lighter this week, with the greatest totals (2-5 inches) limited to northwestern sections of the island which was drought-free. Therefore no changes were made this week.
In Hawaii, as the El Nino induced dry pattern persists, drought impacts are increasing, mainly affecting the agriculture sector and especially the ranching community. With light showers limited to windward locations, the following islands were degraded one category: Kauai – D1 increased along lower elevations of east-facing slopes as pasture conditions worsened; Oahu – introduced D1 to lower elevations of the west side as vegetation conditions degraded with much below-normal rainfall; Maui – increased D1 along the lower elevations of west Maui from Maalaea Harbor to Kapalua as brush fires increased and vegetation worsened; Big Island – added several D2 areas to western slopes of North Kohala, South Kohala, and North Kona Districts. Also added D2 to the Pohakuloa region between Mauna Kea and Mauna Loa, and near South Point in the Kau District. D1 was expanded eastward to the eastern slopes of Mauna Kea. The FSA reported that pasture conditions have worsened over the past few weeks, with some areas possibly heading toward D3 on the Kona side of the island.
Looking Ahead
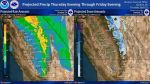
During the next 5 days (March 3-7), heavy precipitation is expected to drench the Pacific Coast. Totals include up to 9 inches in western Washington, 7.3 inches in northwestern California, 8.2 inches in the northern Sierra Nevada, 5 inches near San Francisco, and 1-2 inches near San Diego and Los Angeles. The precipitation will extend eastward into the Intermountain West and northern Rockies, albeit with lower amounts. Unfortunately, little or no precipitation is forecast for the Southwest and southern half of the High Plains. Light to moderate amounts are predicted for most of the eastern half of the Nation, except for dry conditions in Florida. Temperatures should average above-normal in the western half of the U.S., especially the High Plains, and below-normal in the Northeast.For days 6-10 (March 8-12), the odds favor above-median precipitation in the western third and eastern half of the Nation, with the highest probabilities in Oregon and northern California, and the Delta. Below-median probabilities were limited to the northern half of Alaska. Above-median temperatures are likely in the eastern two-thirds of the lower 48 States and southern Alaska, especially the eastern Great Lakes region and Ohio Valley, while below-normal temperatures are favored in the Southwest and western Alaska.
Author(s):
David Miskus, NOAA/NWS/NCEP/CPC
Dryness Categories
D0 ... Abnormally Dry ... used for areas showing dryness but not yet in drought, or for areas recovering from drought.Drought Intensity Categories
D1 ... Moderate DroughtD2 ... Severe Drought
D3 ... Extreme Drought
D4 ... Exceptional Drought
Drought or Dryness Types
S ... Short-Term, typically <6 months (e.g. agricultural, grasslands)L ... Long-Term, typically >6 months (e.g. hydrology, ecology)
Source: National Drought Mitigation Center