


Statistics
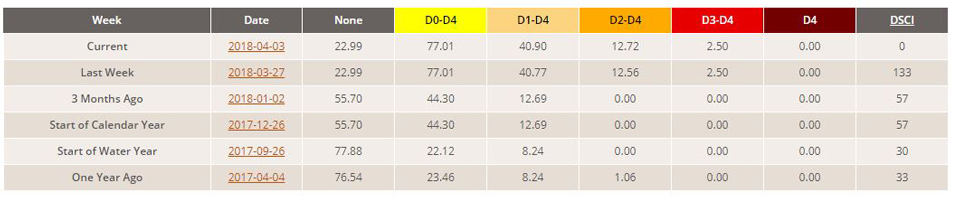
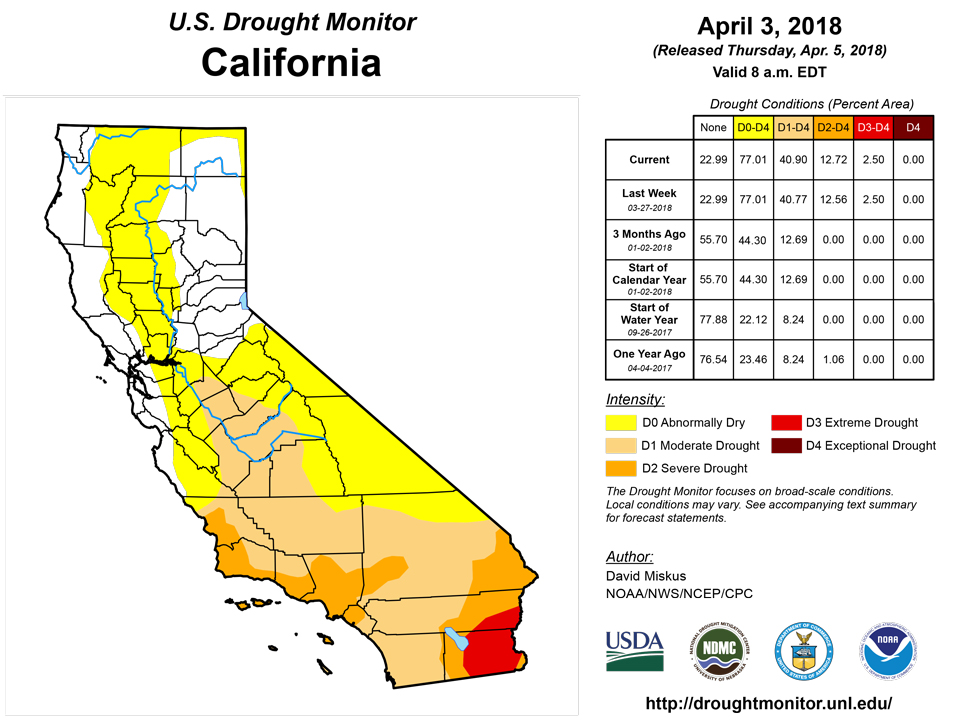
California and National Drought Summary for April 3, 2018
Summary
April 5, 2018 - With a blocking ridge of high pressure anchored over the Southwest, a series of cold fronts tracked across the eastern two-thirds of the Nation. The fronts, however, slowed their southeastward advance across the South and Southeast, and after picking up Gulf moisture, produced numerous and widespread showers and thunderstorms with heavy precipitation (more than 2 inches) from the southern Great Plains northeastward into the northern Appalachians. This was similar to the weather pattern back in mid- to late February when the lower Mississippi, Tennessee, and Ohio Valleys were deluged. Lighter precipitation also occurred across the northern halves of the Rockies and Plains, the upper Midwest, Great Lakes region, western New England, the central Gulf Coast States, and along the Pacific Northwest Coast. Little or no precipitation fell on the remainder of the Far West, Southwest, southern halves of the Rockies and High Plains, western Corn Belt, along the eastern Gulf and Atlantic Coasts, and most of Alaska. Weekly temperatures averaged below normal in the northern Rockies, northern and central Plains, Midwest, mid-Atlantic, and Carolinas, and above-normal in the Far West, Southwest, southern Plains, along the Gulf Coast, and in northern New England. In Alaska, readings were much-above normal in western and northern sections and near to below normal in southern and eastern portions. Most of Hawaii and Puerto Rico observed showery weather.
Northeast
Light to moderate precipitation (1-3 inches) fell on western and southern sections of the region while little or no precipitation was observed along coastal locations. Dryness (D0) or drought (D1) was limited to central Maryland southward into Virginia, and much of this area received 0.25-0.75 inches of precipitation, not enough for improvement but adequate to prevent deterioration. With the region lagging behind in spring growth due to a cold March, impacts were mainly limited to low USGS stream flows (below 25th percentile) and short-term precipitation deficits (1-3 inches at 30, 60, and 90-days), along with longer-term shortages (4-8 inches at 6 and 12-months). USGS 7-day stream flows have recently dropped below the 25th percentile in parts of coastal New England with a dry March, but wet conditions at 60-days and beyond from several winter N’oreasters (plus low temperatures and non-growing season) have kept dryness at bay.
Southeast
Precipitation amounts were greatest (0.5-1.5 inches) in western and southern sections, while little or no precipitation fell on southeastern Virginia, the Carolinas, eastern Georgia, and most of Florida. Since the previous week saw light to moderate amounts in Virginia and North Carolina, no deterioration was made in those two states as low 7-day USGS stream flows and short-term deficits remained in the D1 and D0 areas. Farther south, however, the combination of lower precipitation and higher normal translated to 50-75% of normal precipitation and deficiencies of 3-6 and 4-8 inches at 60- and 90-days, respectively, and led to an expansion of D0, D1, and D2 in extreme southeastern North Carolina, eastern South Carolina, and southeastern Georgia. Farther south, mostly dry and warm weather promoted deterioration across most of Florida, with some increases of D0-D1 in eastern and southern sections, and a new D2 in extreme southern Florida based upon low water levels, rainfall, and meteorological drought indicators. Although the winter and spring months are normally dry in most of Florida, an early cessation to the 2017 rainy season and subnormal winter and spring precipitation has promoted recent drought conditions. In contrast, 0.5-2 inches of rain in southwest and northwest Alabama was enough to trim away some of the D0 and D1 in the westernmost edges. Elsewhere in Alabama and western Georgia, not enough rain fell to improve conditions, but did keep the area at status-quo.
South
Similar to mid-February when heavy rains inundated the south-central Great Plains, lower Mississippi, Tennessee, and Ohio Valleys and provided instant relief from drought, heavy rains fell along an identical track, except this time south-central Texas received more precipitation than 6 weeks ago, and Arkansas saw less. Eerily similar was the demarcation line of minimal rain versus decent rain in central Oklahoma where western sections of the state yet again missed out on the moisture. Luckily, this was not the case in western Texas where areas between Lamesa and Lubbock finally received 0.5-1.5” of rain. Lubbock’s 0.77” of rain on Mar. 27 exceeded their Oct. 7-Mar. 26 total of 0.40”. Amarillo’s 0.24” on Mar. 27 was even more than their Oct. 7-Mar. 26 amount of 0.07”. Take away an extremely wet early October (2.14” from Oct. 3-6) and Amarillo’s conditions would have been even worse. From south-central Texas northeastward into western Louisiana, a swath of 3-8” of rain provided 1-2 categories of drought improvement, while more scattered bands of moderate to heavy rain allowed limited 1-category improvement in parts of southern and central Texas. The aforementioned rains in west Texas were responsible for a D3 to D2 upgrade as most tools responded. Some slight westward adjustments (improvements) of the D0 edge in north-central Texas and central Oklahoma were made as the cutoff between decent and scanty rains occurred. Unfortunately, another week with little or no precipitation in northern Texas, western half of Oklahoma, and Kansas led to additional deterioration as D4 spread into parts of the Oklahoma and northern Texas Panhandles as gusty winds produced sand storms in the area.
Midwest
Light to moderate precipitation (0.5-1.5” liquid equivalence) fell across central Minnesota, northern Wisconsin, and the UP of Michigan, increasing the snow cover in the region and decreasing the short-term deficiencies. With most tools out to 6-months showing near or wet conditions, D0 was removed from central and southeastern Wisconsin and part of the UP of Michigan, but left where the same indices showed D0-D1. The small D0-D1 in northern Minnesota was dry, but is covered under a blanket of snow with frozen ground and will be reassessed once conditions thaw. Elsewhere, southern Iowa and northern and western Missouri had lingering drought, and some of these locations received 0.5-1 inches of precipitation. With moderate to heavy
precipitation occurring in mid-February and lighter amounts during March, this week’s additional precipitation was enough to erase deficits at 90-days and create short-term surpluses. Accordingly, D0 was removed from southwestern and along the northern Missouri D0 edge, along with a small area of D1 improved to D0 in northeastern Missouri. Elsewhere in the Midwest, there was no prior dryness or drought, and 2018’s wet pattern continued this week.
High Plains
The persistent fall and winter pattern of above-normal precipitation and subnormal temperatures continued this week across Montana, Wyoming, and the western Dakotas, building up the existing snow cover and gradually providing additional relief from long-term drought. In eastern Montana, SPIs out to 9-months were wet except in the extreme northeastern part of the state (Daniels and Sheridan counties) where D2 lingered. Similarly in extreme western Dakotas and northeastern Wyoming, additional precipitation allowed for a slight nudge of the D0-D2 areas to the east (improvement). However, since this drought goes back to 12-15 months ago, it will take more precipitation to remove these long-term deficits (6-10 inches) and subsoil impacts where D1 and D2 are currently depicted, hopefully during the upcoming wet season (April-July). In central and eastern North Dakota where the drought was short-term, snow totals of 1-2” in the central and 4-6” in the east added to 90-day surpluses. Even though soil moisture conditions are less than desired (ground barely frozen at 4” depth), 90-day percent of normal precipitation has shown significant improvement. Therefore, some D1 was improved to D0 in central parts of the state while D0 was erased from eastern areas. In Nebraska, moderate snows fell across southern sections of the state, but D0 was kept as subsoil dryness lingered due to frozen ground earlier in the year that limited infiltration of melting snow or rain. As conditions thaw and additional storms occur, infiltration should increase. Farther south in Kansas, little or no precipitation meant another week of growing deficits, and based upon indices going out to a year, D3 conditions were common in central and northeastern portions of the state; therefore D3 was expanded northeastward.
West
After a very wet March and prior week in California, tranquil weather (mild and dry) enveloped the state and much of the West, with only light precipitation falling on western Washington and Oregon, northern Idaho, most of Montana, northern and eastern Wyoming, and northern Colorado. Fortunately for California, March provided several welcome slugs of moisture to the Sierra Nevada snow pack after one of the driest Februarys on record, bumping April 1 statewide SWE readings to 52% of normal, up from 23% on March 1, but still below the average. Major state reservoirs were at or above normal April 1 averages largely due to last winter’s bountiful precipitation. In Oregon, last week’s precipitation was also enough to keep status-quo during this week’s dry weather, although April 1 NRCS average basin numbers were still below normal (75-87% precipitation, 44-64% SWE). WYTD precipitation and SWE statistics are better toward the north and east, with northern Oregon, Washington, most of Idaho, northeastern Nevada, Montana, and Wyoming at or above normal.
Unfortunately, the trend of the Southwest missing significant precipitation during the winter has extended into the spring, with NRCS average basin (especially the Four Corners region states) precipitation and SWE running at 20-70% and 0-60% of normal, respectively. With most WYTD tools depicting D2-D4 conditions, along with reported impacts, some deterioration was made in northwest Arizona (D2 expansion in Mohave County); north-central Utah (D2 into Salt Lake County, D3 increase in Utah County); southern Colorado (D2 in Pueblo County, D3 into eastern Las Animas, eastern Otero, and western Bent Counties); and a slight southward extension of D3 into west-central and east-central New Mexico. As the spring season continues, temperatures will rise and precipitation normally decreases, so the short-term outlook is not favorable for any improvement based strictly on climatology.
Alaska, Hawaii, and Puerto Rico
No dryness or drought was in Hawaii or Puerto Rico last week, and with continuing showery (wet) conditions at both locations, none was drawn. In Alaska, the end of March NRCS snow surveys showed well above-normal (135-150%) snow water equivalents [SWE] in southwestern and interior basins due to several decent snowfalls during the month; thus, D0 was removed from southwestern sections west of the Alaska Range. In contrast, a generally dry week and JFM 2018 precipitation of 65-80% of normal along with subnormal SWE basins (50-80%) shifted the D0 across south-central coastal Alaska (Kenai Peninsula) and maintained D0-D1 in the southeastern Panhandle.
Looking Ahead
During April 5-9, 2018, unseasonably heavy precipitation (2-6 inches) is expected in western sections of Washington, Oregon, and the northern half of California, plus the Cascades and Sierra Nevada, with lesser amounts in the remainder of the Northwest and northern and central Rockies. Unfortunately, a sharp cutoff of precipitation (dry) is forecast for southern California, southern Nevada, and much of Arizona, New Mexico, and west Texas. Light precipitation (less than half an inch) is predicted across the northern half of the Plains, Midwest, and southern Great Plains, with greater totals (1-3 inches) in the lower Mississippi Valley, Southeast, mid-Atlantic, and New England. Temperatures will average above-normal west of the Rockies, southern Texas, and Florida, and below-normal east of the Rockies except along the Gulf Coast.
For the ensuing 5 days (April 10-14), odds favor above-median precipitation for much of the Far West, northern thirds of the Rockies and Plains, Midwest, lower Mississippi Valley, New England, and southern Florida, with sub-median totals in the Southwest and south-central High Plains, Southeast, and northern Alaska. Chances for sub-median temperatures are likely across the northern half of the Nation, but especially in the upper Midwest and along the Northeast Coast. A tilt toward above-median readings are expected in the Southwest, southern Rockies, southern half of the Plains, southern Florida, and southern Alaska.
Author(s):
David Miskus, NOAA/NWS/NCEP/CPC
Dryness Categories
D0 Abnormally Dry—used for areas showing dryness but not yet in drought, or for areas recovering from drought.
Drought Intensity Categories
D1 Moderate Drought
D2 Severe Drought
D3 Extreme Drought
D4 Exceptional Drought
Drought or Dryness Types
S Short-Term, typically less than 6 months (e.g. agricultural, grasslands)
L Long-Term, typically greater than 6 months (e.g. hydrologic, ecologic)
Source: National Drought Mitigation Center
