


In CBO’s projections, the economy grows relatively quickly this year and next and then more slowly in the following several years. The federal budget deficit rises substantially, boosting federal debt to nearly 100 percent of GDP by 2028.
View Document
April 10, 2018 - In CBO’s baseline projections, which incorporate the assumption that current laws governing taxes and spending generally remain unchanged, the federal budget deficit grows substantially over the next few years. Later on, between 2023 and 2028, it stabilizes in relation to the size of the economy, though at a high level by historical standards.
As a result, federal debt is projected to be on a steadily rising trajectory throughout the coming decade. Debt held by the public, which has doubled in the past 10 years as a percentage of gross domestic product (GDP), approaches 100 percent of GDP by 2028 in CBO’s projections. That amount is far greater than the debt in any year since just after World War II. Moreover, if lawmakers changed current law to maintain certain current policies—preventing a significant increase in individual income taxes in 2026 and drops in funding for defense and nondefense discretionary programs in 2020, for example—the result would be even larger increases in debt.
Projected deficits over the 2018–2027 period have increased markedly since June 2017, when CBO issued its previous projections. The increase stems primarily from tax and spending legislation enacted since then—especially Public Law 115-97 (originally called the Tax Cuts and Jobs Act and called the 2017 tax act in this report), the Bipartisan Budget Act of 2018 (P.L. 115-123), and the Consolidated Appropriations Act, 2018 (P.L. 115-141). The legislation has significantly reduced revenues and increased outlays anticipated under current law.
In CBO’s economic projections, which underlie its budget projections, output grows at a faster pace this year than in 2017, as the recent changes in fiscal policy add to existing momentum in spending on goods and services. Growth in actual GDP outpaces growth in potential (that is, maximum sustainable) GDP both this year and next, pushing the unemployment rate down. After 2019, economic growth is projected to slow, eventually matching CBO’s estimate of the economy’s maximum sustainable rate of growth.
Real GDP (that is, GDP adjusted to remove the effects of inflation) and real potential GDP are now projected to be greater throughout the coming decade than projected last June, in part because of the significant recent changes in fiscal policy. Also, interest rates are projected to be higher and the unemployment rate lower in the next few years than CBO projected previously.
Even if federal laws did generally remain in place, budgetary and economic outcomes would be difficult to predict and thus uncertain. CBO’s projections, especially its economic projections, are even more uncertain than usual this year, because they incorporate estimates of the economic effects of the recent changes in fiscal policy—and those estimates are themselves uncertain. CBO aims to formulate projections that fall in the middle of the distribution of possible outcomes.
Economic Growth Is Projected to Be Relatively Strong This Year and Next and Then to Moderate
In CBO’s projections, the growth of real GDP exceeds the growth of real potential output over the next two years, putting upward pressure on inflation and interest rates (see figure below). But during the 2020–2026 period, a number of factors dampen economic growth: higher interest rates and prices, slower growth in federal outlays, and the expiration of reductions in personal income tax rates. After 2026, economic growth is projected to rise slightly, matching the growth rate of potential output by 2028.

Economic Growth
Between 2018 and 2028, actual and potential real output alike are projected to expand at an average annual rate of 1.9 percent. In CBO’s forecast, the growth of potential GDP is the key determinant of the growth of actual GDP through 2028, because actual output is very near its potential level now and is projected to be near its potential level at the end of the period.
Potential output is projected to grow more quickly than it has since the start of the 2007–2009 recession, as the growth of productivity increases to nearly its average over the past 25 years and as the recent changes in fiscal policy boost incentives to work, save, and invest. Nonetheless, potential output is projected to grow more slowly than it did in earlier decades, held down by slower growth of the labor force (which results partly from the ongoing retirement of baby boomers).
In CBO’s projections, real GDP expands by 3.3 percent this year and by 2.4 percent in 2019. It grew by 2.6 percent last year. Most of the growth in output in the next two years is driven by consumer spending and business investment, but federal spending also contributes a significant amount this year. After averaging 1.7 percent from 2020 through 2026, real GDP growth is projected to average 1.8 percent in the last two years of the 2018–2028 period.
Effects of Recent Legislation on the Economy
The recently enacted legislation has shaped the economic outlook in significant ways. In CBO’s projections, the effects of the 2017 tax act on incentives to work, save, and invest raise real potential GDP throughout the 2018–2028 period. In addition, all three major laws mentioned above provide fiscal stimulus, raising real GDP more than potential GDP in the near term. Over the longer term, all of those effects, as well as the larger federal budget deficits resulting from the new laws, exert upward pressure on interest rates and prices.
The largest effects on GDP over the decade stem from the tax act. In CBO’s projections, it boosts the level of real GDP by an average of 0.7 percent and nonfarm payroll employment by an average of 1.1 million jobs over the 2018–2028 period. During those years, the act also raises the level of real gross national product (GNP) by an annual average of about $470 per person in 2018 dollars. (GNP differs from GDP by including the income that U.S. residents earn from abroad and excluding the income that nonresidents earn from domestic sources; it is therefore a better measure of the income available to U.S. residents.) Those projected effects grow in the earlier years of the period and become smaller in the later years.
The other two laws are estimated to increase output in the near term but dampen it over the longer term. The fiscal stimulus that they provide boosts GDP by 0.3 percent in 2018 and by 0.6 percent in 2019, in CBO’s assessment. However, the larger budget deficits that would result are estimated to reduce the resources available for private investment, lowering GDP in later years.
GDP Is Projected to Be Greater Than CBO Previously Estimated
CBO’s current economic projections differ from those that the agency made in June 2017 in a number of ways. The most significant is that potential and actual real GDP are projected to grow more quickly over the next few years. As a result, the levels of those measures are 1.6 percent higher than CBO previously estimated for 2027 (the last year in the previous projection period). Projected output is greater because of recently enacted legislation, data that became available after CBO’s previous economic projections were completed, and improvements in the agency’s analytical methods. Also, because inflation is now anticipated to be higher, the level of nominal GDP is projected to be 2.4 percent higher in 2027 than previously estimated.
Over the next decade, the unemployment rate is lower in CBO’s current projections than in its previous ones—particularly during the next few years, when economic stimulus boosts demand for labor. Also, both short-and long-term interest rates are projected to be higher, on average, from 2018 to 2023—by roughly 0.7 percentage points and 0.4 percentage points, respectively—than projected in June. That faster rise in interest rates primarily reflects stronger overall demand.
Deficits Are Projected to Be Large by Historical Standards
CBO estimates that the 2018 deficit will total $804 billion, $139 billion more than the $665 billion shortfall recorded in 2017. Both amounts, however, are affected by shifts in the timing of some payments. Outlays in 2018—and thus the deficit—have been reduced by $44 billion because October 1, 2017 (the first day of fiscal year 2018), fell on a weekend; as a result, certain payments that were to be made on that day were instead made in September, in fiscal year 2017. If not for those shifts, the deficit projected for 2018 would be $848 billion.
In CBO’s projections, budget deficits continue increasing after 2018, rising from 4.2 percent of GDP this year to 5.1 percent in 2022 (adjusted to exclude the shifts in timing). That percentage has been exceeded in only five years since 1946; four of those years followed the deep 2007–2009 recession. Deficits remain at 5.1 percent between 2022 and 2025 before dipping at the end of the period, primarily because some tax provisions are scheduled to expire under current law, boosting revenues. Over the 2021–2028 period, projected deficits average 4.9 percent of GDP; the only time since World War II when the average deficit has been so large over so many years was after the 2007–2009 recession.
Revenues
For the next few years, revenues hover near their 2018 level of 16.6 percent of GDP in CBO’s projections. Then they rise steadily, reaching 17.5 percent of GDP by 2025. At the end of that year, many provisions of the 2017 tax act expire, causing receipts to rise sharply—to 18.1 percent of GDP in 2026 and 18.5 percent in 2027 and 2028. They have averaged 17.4 percent of GDP over the past 50 years.
Outlays
In CBO’s projections, outlays for the next three years remain near 21 percent of GDP, which is higher than their average of 20.3 percent over the past 50 years. After that, outlays grow more quickly than the economy does, reaching 23.3 percent of GDP (adjusted to exclude shifts in timing) by 2028.
That increase reflects significant growth in mandatory spending—mainly because the aging of the population and rising health care costs per beneficiary are projected to increase spending for Social Security and Medicare, among other programs. It also reflects significant growth in interest costs, which are projected to grow more quickly than any other major component of the budget, the result of rising interest rates and mounting debt. By 2028, net outlays for interest are projected to be roughly triple what they are this year in nominal terms and roughly double when measured as a percentage of GDP. In contrast, discretionary spending in the projections declines in relation to the size of the economy.
Deficits Are Projected to Be Larger Than CBO Previously Estimated
The deficit that CBO now estimates for 2018 is $242 billion larger than the one that it projected for that year in June 2017. Accounting for most of that difference is a $194 billion reduction in projected revenues, mainly because the 2017 tax act is expected to reduce collections of individual and corporate income taxes.
For the 2018–2027 period, CBO now projects a cumulative deficit that is $1.6 trillion larger than the $10.1 trillion that the agency anticipated in June. Projected revenues are lower by $1.0 trillion, and projected outlays are higher by $0.5 trillion.
Laws enacted since June 2017—above all, the three mentioned above—are estimated to make deficits $2.7 trillion larger than previously projected between 2018 and 2027, an effect that results from reducing revenues by $1.7 trillion (or 4 percent) and increasing outlays by $1.0 trillion (or 2 percent). The reduction in projected revenues stems primarily from the lower individual income tax rates that the tax act has put in place for much of the period. Projected outlays are higher mostly because the other two pieces of legislation will increase discretionary spending. Those revenue reductions and spending increases would result in larger deficits and thus in higher interest costs than CBO previously projected.
In contrast, revisions to CBO’s economic projections caused the agency to reduce its estimate of the cumulative deficit by $1.0 trillion. Expectations of faster growth in the economy and in wages and corporate profits led to an increase of $1.1 trillion in projected tax receipts from all sources. Other changes had relatively small net effects on the projections.
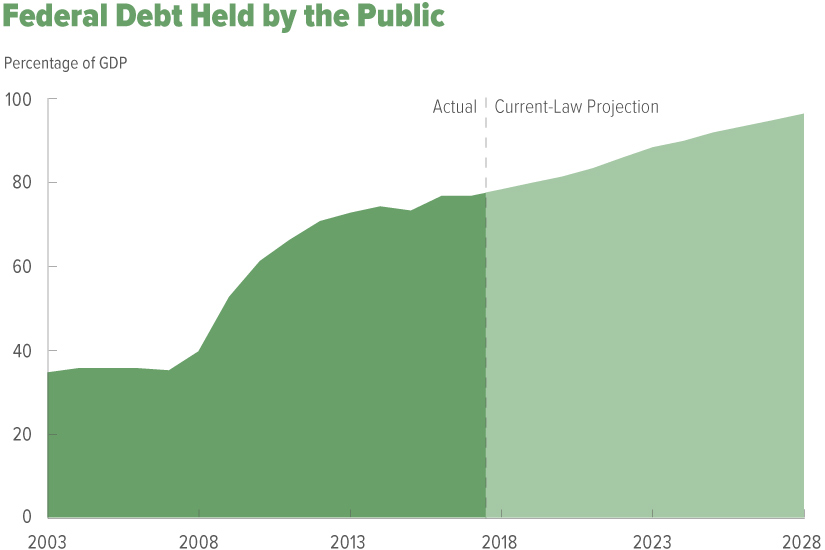
Debt Held by the Public Is Projected to Approach 100 Percent of GDP
As deficits accumulate in CBO’s projections, debt held by the public rises from 78 percent of GDP (or $16 trillion) at the end of 2018 to 96 percent of GDP (or $29 trillion) by 2028. That percentage would be the largest since 1946 and well more than twice the average over the past five decades (see figure below).

Such high and rising debt would have serious negative consequences for the budget and the nation:
- Federal spending on interest payments on that debt would increase substantially, especially because interest rates are projected to rise over the next few years.
- Because federal borrowing reduces total saving in the economy over time, the nation’s capital stock would ultimately be smaller, and productivity and total wages would be lower.
- Lawmakers would have less flexibility to use tax and spending policies to respond to unexpected challenges.
- The likelihood of a fiscal crisis in the United States would increase. There would be a greater risk that investors would become unwilling to finance the government’s borrowing unless they were compensated with very high interest rates; if that happened, interest rates on federal debt would rise suddenly and sharply.
Deficits and Debt Would Be Larger If Some Current Policies Were Continued
CBO also analyzed an alternative scenario in which current law was altered to maintain major policies that are now in place and to provide more typical amounts of emergency funding than the sums provided for 2018. Specifically, CBO analyzed what would happen if:
- More than 50 expiring revenue provisions were extended, including the individual income tax provisions of the 2017 tax act;
- Delays in implementing certain taxes established by the Affordable Care Act were extended or made permanent;
- Scheduled limits on discretionary appropriations did not take effect, and most appropriations instead grew each year from their 2018 amount at the rate of inflation; and
- Lawmakers provided inflation-adjusted emergency appropriations for nondefense discretionary programs equal to the average amount of such funding from 2012 through 2017—about $11 billion—each year between 2019 and 2028, rather than the roughly $100 billion a year projected in the baseline.
In that scenario, far larger deficits and much greater debt would result than in CBO’s baseline projections for the 2019–2028 period. Deficits would be larger by an average of a full percentage point of GDP, rising by a total of $2.6 trillion to yield a cumulative deficit of nearly $15 trillion over that period. And debt held by the public would reach about 105 percent of GDP by the end of 2028, an amount that has been exceeded only once in the nation’s history. Moreover, the pressures contributing to that rise would accelerate and push debt up even more sharply in subsequent decades.
Source: CBO

