


Statistics
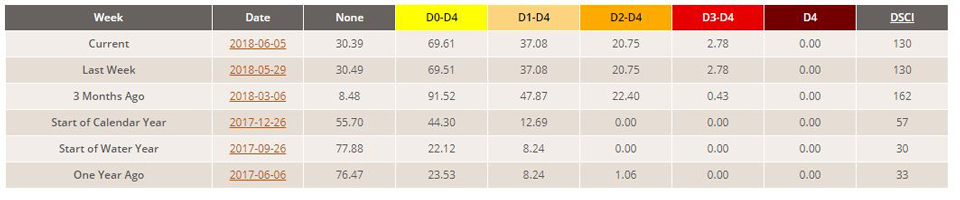
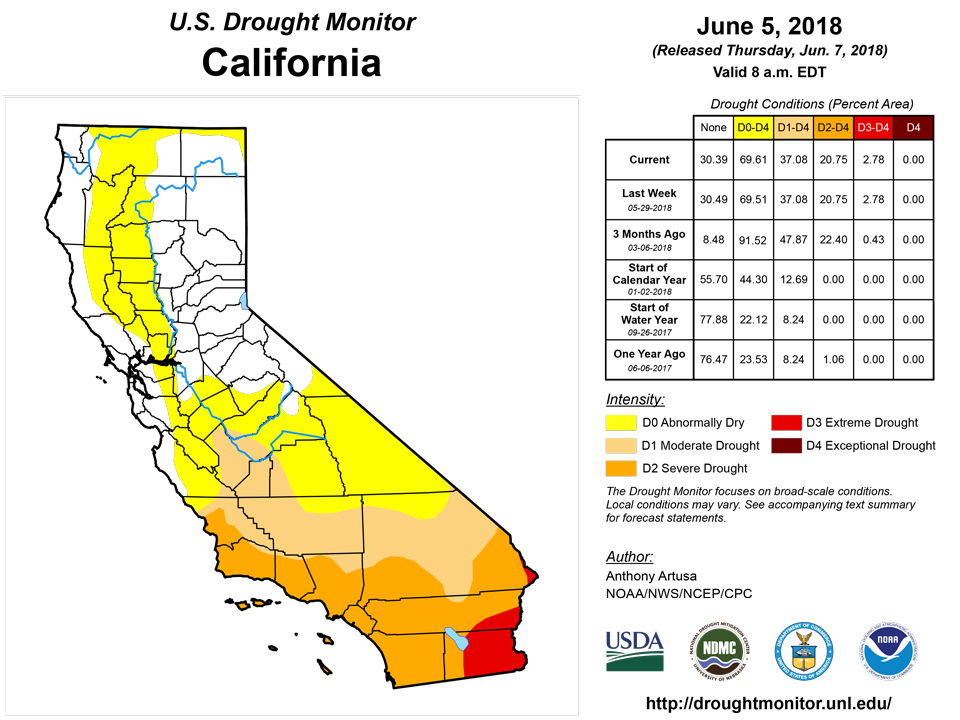
California and National Drought Summary for June 5, 2018
Summary
June 7, 2018 - Frontal and thunderstorm activity provided moderate to heavy rain (at least 0.5-inch) over northern, eastern, and central portions of the CONUS this past week. A weakness in the mid-tropospheric subtropical ridge over the Gulf of Mexico and southeastern states contributed to the influx of subtropical moisture across this region. Over the weekend, a cold front moved into the mid-Atlantic area and stalled, providing a lifting mechanism for the inflowing moisture. This resulted in heavy rain (generally 2-6 inches, locally greater) across much of Virginia, Maryland, eastern West Virginia, and southern Pennsylvania. Temperatures were near to above average across practically the entire contiguous U.S., with the greatest departures (6-12 degrees F above average, locally greater) for a large portion of the southern Great Plains, the Mississippi Valley, the Dakotas, the Great Lakes region, and the Ohio Valley.
Northeast
Temperatures (ACIS) during the past 7-days ranged from about 1-6 degrees F above average in New England. Precipitation deficits for the past 30-days ranged from about 1-4 inches below normal, with the higher deficits indicated over far southern Maine and adjacent portions of New Hampshire. Stream flows in this area are within the lowest quartile of the historical distribution for this day of the year, especially in Maine. USDA/NASS topsoil moisture is 70% very short to short in New Hampshire, 55% in Massachusetts, and 48% in Maine. Based on these factors, abnormal dryness (D0) was expanded to include most of New Hampshire, the western half of the Maine coast, and northeast Massachusetts.
Southeast
Although southern Virginia did not receive the very heavy rainfall that was reported just to its north, it still received enough to justify wiping out any residual dryness. In North Carolina, while some areas were too wet for farmers to complete field operations due to rainfall over the last few weeks, most areas were showing normal groundwater conditions, and the remaining D0 area in the state was removed. Any lingering D0 was also removed in Georgia this week, consistent with adequate soil moisture conditions. As of this writing, Athens, GA, reported at least 19 consecutive days of measurable rain so far. Eleven locations (CoCoRaHS and COOP) have measured 13 or more inches of rain for the month of May in northeastern Georgia, with 2 locations in west-central Georgia. In Alabama, streams were near or above normal in the aftermath of Alberto. D0 was trimmed out of Tallapoosa, Clay, Randolph, and northern Chambers Counties in the northeast part of the state, while D0 was added to Etowah County. In southwest Alabama, D0 was expanded into eastern Washington County.
South
According to ACIS, measured precipitation during the past 7-days was less than 0.5-inch over much of the South. Weekly temperature departures generally ranged between 4-10 degrees F above average. Significant 30-day precipitation deficits and near-record warm temperatures prompted the expansion of D0 across portions of Texas. In fact, the entire Texas drought depiction experienced another major overhaul this week. Low stream flows have been an issue in the Texas Hill Country for several months already. The position of the impacts line was adjusted to approximately bifurcate the state into a western portion (now SL, with longer-term deficits appearing), and an eastern portion (still S). Across the deep South Texas counties of Willacy and northern Cameron, conditions were degraded this week from D1 to D2, based on stressed fields of cotton (despite ongoing irrigation), high KBDI levels (600-700), and a 120-day SPI blend. In Oklahoma, continuing degradation of conditions led to an expansion of both D0 and D1 in southeast parts of the state. A few tweaks were made to the depiction in western Oklahoma as well, based on recent rainfall. Hot, relatively dry conditions prompted a broad expansion of D0 across most of Louisiana, western Arkansas, and adjacent portions of western and southern Mississippi this week. Current NLDAS soil moisture anomalies for the root zone (top one-meter) indicate values ranging from 1-3 inches below normal. Shreveport, LA, reported its warmest May on record, 78.4 degrees F, which supplanted the old record of 77.8 degrees F set back in 1933. Two areas of D1 were introduced in northwestern and south-central Louisiana this week. Topsoil moisture (Very Short to Short) for a few states include: Louisiana (73% this week, 55% last week), Arkansas (34%, 21%), Mississippi (22%, 14%) and for the Contiguous U.S. as a whole (28%, no change from last week). For Rangeland/Pastures, the percentages rated Very Poor to Poor this week compared to last week include: Louisiana (30% this week, 17% last week), Arkansas (6%, 8%), Mississippi (11%, 11%).
Midwest
The Midwest drought depiction was altered this week based largely on recent rainfall. In northern Minnesota, northern Wisconsin, and northern Michigan, areas of abnormal dryness (D0) were trimmed away. Factors considered included the AHPS 200 Percent of Normal Precipitation (PNP) map, 30-day SPI, and near to above-normal stream flows. In Indiana, despite some rain during the previous week, deficits were still significant enough to warrant an expansion of the D0 area from southwestern Indiana northeastward to central Indiana, including Indianapolis. This expansion is aligned with the 7-day observed minimum precipitation axis through this area, and has additional support from ACIS 30-day and 60-day SPI maps, ACIS 60-day Departure from Normal Precipitation (DNP), and broad support from the June 4th VegDRI map. In central Iowa, D0 was introduced based on PNPs less than 50% over the last month. In northwestern
Missouri, St. Joseph (Buchanan County) reported 19.28 inches of precipitation over the past year (Jun 1, 2017-May 30, 2018). Normal precipitation for this area and time period is 35.60 inches. Many different types of plants (such as woody, some perennials, and evergreen), and trees (such as pines, yews, and boxwoods) have shown significant amounts of stress from the drought. In nearby Hamilton, the city lake is very low, as are many ponds throughout the region. This week, severe drought (D2) was expanded across northwest Missouri, and approximately the eastern half of the moderate drought (D1) area in northern Missouri was expanded slightly southeastward. In Illinois, a north-south oriented, split band of heavy rain (3-6 inches) fell in the Peoria area very early in the drought week, associated with the departing remnants of Alberto. D0 was broadly expanded across a substantial portion of central and eastern Illinois, connecting up with the D0 over southwestern Indiana. This is related to the combination of short-term dryness and 90-degree temperatures, which appear to be causing water stress on corn and soybeans.
Incidentally, the importance of rapid loss of moisture through evaporation has become a very important consideration in early detection of flash drought; hence the increasing reliance upon the Evaporative Demand Drought Index (EDDI). High values of the 2-week EDDI (ED1 to ED3) across the Corn Belt are indicative of significant moisture loss, which must be balanced against any moisture gains that occur through precipitation. It is the interplay between evaporation, high heat, rainfall, soil moisture, and wind speeds that has a significant bearing on accurate drought prediction.
High Plains
Heavy rain (2-6 inches, locally greater) fell over portions of North Dakota this week, with the highest amounts over the northwest part of the state. Much of the heaviest rain actually fell north of the Canadian border in extreme southeastern Saskatchewan. Slight alterations (both improvement and deterioration) were rendered to the depiction in western, north-central, and southeastern North Dakota, based in part on the 1-month EDDI, which takes into account evaporative demand. Both improvements and degradations were also made to the South Dakota depiction, which received much less rain this week than its northern counterpart. For example, Aberdeen reported only 0.52-inch of rain in May (2.59 inches below normal), making it the seventh driest on record. An area of severe drought (D2) was introduced to northeastern South Dakota, based on 60-day precipitation deficits, 30-day and 60-day SPI, recent warm temperatures, and increased water demand through evapotranspiration. A spectacular dust storm, attended by 50-80 mph winds, blew through this region (Hand and Faulk Counties) on June 1st. In southeastern Colorado, a one-category degradation was made to the depiction in Kiowa County. Decent soil moisture from the wet summer and fall of 2017 is now gone, due to the recent hot, dry weather. This, in turn, has taken its toll on crops. Although welcome rains fell across eastern Nebraska this week, it was decided not to make any changes to the state depiction until more information is at hand next week.
West
Minor adjustments were made this week to the D0 area along the eastern Montana state line. In northwestern Montana, it was eventually decided to postpone the introduction of D0 to the region. Although some drying has occurred, this area experiences healthy stream and river flows, due to continuing snow melt. In nearby northern Idaho, recent flooding precludes the introduction of any D0 at this time. This area will continue to be monitored for the possible inclusion of D0 in the next week or two. In western Oregon and western Washington, an extended dry pattern set in ahead of schedule, with rapidly declining stream flows (most are now within the lowest quartile of the historical distribution for the day of the year). There is a notable degradation in the SPI maps going from 60- to 30-days out. The more recent SPI values in this region range between -2.0 and -2.5. Accordingly, D0 was expanded across western portions of both Oregon and Washington this week. Finally, in southwestern New Mexico, water restrictions were initiated as storage in the Elephant Butte and Caballo reservoirs (along the Rio Grande in Sierra County) dropped below 400,000 acre-feet.
Alaska, Hawaii, and Puerto Rico
In Puerto Rico, June and the first half of July are climatologically dry times of the year. Satellite imagery from the Visible Infrared Imaging Radiometer Suite (VIIRS) reveals the southern slopes of the island are drying out. These two factors led to the introduction of D0 in this region. No changes were deemed necessary this week in either Hawaii or Alaska.
Looking Ahead
For the ensuing 5-day period (June 7-11, 2018), the northern and eastern CONUS are generally predicted to receive 0.5-1.5 inches of rain. Heavier amounts are forecast over portions of the western Corn Belt, the southern Great Lakes region, and the Florida peninsula. A relative maximum of 3-4 inches is possible in Iowa, likely due to nocturnal thunderstorm clusters (MCS) which are common at this time of year. Little to no precipitation is expected elsewhere during this period. For the subsequent 5-day period (June 12-16, 2018), CPC predicts elevated odds of above normal rainfall across the southern CONUS, with a weak tilt toward above running northward across the Mississippi Valley and eastern Great Plains region. Elevated odds of below normal rainfall are highlighted over the Northwest, the northern High Plains, and most of the Atlantic Coast states from Maine to Virginia.
Author(s):
Anthony Artusa, NOAA/NWS/NCEP/CPC
Dryness Categories
D0 Abnormally Dry—used for areas showing dryness but not yet in drought, or for areas recovering from drought.
Drought Intensity Categories
D1 Moderate Drought
D2 Severe Drought
D3 Extreme Drought
D4 Exceptional Drought
Drought or Dryness Types
S Short-Term, typically less than 6 months (e.g. agricultural, grasslands)
L Long-Term, typically greater than 6 months (e.g. hydrologic, ecologic)
Source: National Drought Mitigation Center

