


California and National Drought Summary for November 27, 2018
Summary
November 29, 2018 - A series of upper-level weather systems, and their associated surface lows and fronts, moved across the contiguous U.S. (CONUS) during this U.S. Drought Monitor (USDM) week. They brought beneficial precipitation to much of the Pacific coast; parts of the northern and central Rockies, central Plains, Midwest, and Gulf of Mexico coast; and much of the Mid-Atlantic to Northeast. But they missed much of the Southwest, northern Plains, and southern Plains, where no precipitation, or less than a tenth of an inch, fell. Based on precipitation recorded through the 12z (7:00 a.m. EST) cutoff on Tuesday morning, the precipitation was less than the weekly normal across parts of the interior Pacific Northwest and northern New England, and much of the Midwest and Southeast. While beneficial, the precipitation in the West was mostly not enough to overcome months of precipitation deficits. Slight contraction of drought or abnormal dryness occurred in parts of Arizona (a reassessment), Colorado, and Montana, while expansion occurred in southern California and Nevada. Building precipitation deficits prompted expansion in the southern Plains. Rain and snow from the weather systems this week – and previous weeks to the last 6 months – have built up precipitation surpluses across much of the country east of the Mississippi River, with streamflow mostly above normal and November 25 reports from the U.S. Department of Agriculture (USDA) showing soil moisture surpluses in most states here, Florida and coastal Georgia and South Carolina being the exceptions. Contraction and expansion of abnormal dryness occurred in coastal Georgia and South Carolina to accommodate a variable precipitation pattern.
Northeast
Two inches or more of precipitation occurred along the coast from Maryland and Delaware to Massachusetts, and in a couple spots in Upstate New York, with the rest of the Northeast receiving 0.5-2.0 inches. Enough precipitation fell to reduce long-term deficits along the New York-Vermont state line, where D0 was pulled back. But no change was made to the other D0 remaining in northern New York and northern New England due to lingering long-term (3 months or longer) deficits.
Southeast
Strips of precipitation amounting to 0.5 to 1.0 inch occurred from central Alabama to northern Georgia, the Florida panhandle to coastal Georgia, and the Carolinas to Virginia. A few areas in these strips received 1 to 2 inches of rain. But parts of Alabama, Georgia, and South Carolina, and especially the southern half of Florida, received less than half an inch of rain. Precipitation deficits existed along the Georgia and South Carolina coasts from 1 week to 12 months, with the exact locations varying depending on time scale. For example, the downtown Charleston station has a deficit of 4 inches for the year and 4.5 inches since September 1. Savannah is down over 9 inches for the year and about 1.5 inches since September 1. D0 contracted in parts of coastal Georgia where it was wet and expanded in parts of coastal Georgia and South Carolina where dryness persisted. No change was made to the depiction in Florida this week. But dryness in southern Florida was reflected by several indicators, including streamflow, percent of normal precipitation, the Standardized Precipitation Index (SPI), the Standardized Precipitation Evapotranspiration Index (SPEI), soil moisture models and USDA soil moisture reports, groundwater estimates, and the VegDRI vegetation-based drought index. Expansion of D1 in southern Florida can be expected to occur in the weeks ahead if the dryness worsens.
South
Half an inch of precipitation fell across parts of coastal Texas and Louisiana, parts of Mississippi, and extreme northeastern Arkansas. But most of Texas and Oklahoma received no precipitation this week, and have been drier than normal for most of the last 4-7 weeks. Mounting dryness over the last 3-6 months prompted expansion of D0-D1 in northeast Oklahoma into northwest Arkansas, with some D0 expanding into adjacent southwest Missouri and bleeding slightly into adjacent southeast Kansas. The areas of D0-D1 in Texas remained unchanged this week.
Midwest
A band of 0.5-2.0 inches of precipitation stretched from northern Missouri and southern Iowa to Lakes Erie and Huron; 0.5-1.0 inch was spread across the Lake Superior area; and 0.5-1.5 inches occurred across Indiana and Ohio. Outside of these areas, less than half an inch of precipitation fell. Most of the Midwest was free of drought or abnormal dryness. The precipitation that fell across Missouri was not enough to affect the existing D0 in western and northern Missouri. With continued dryness across southern Missouri, D0 spread into the southwestern portion of the state to reflect mounting deficits over the last 3-6 months, as well as lingering dryness at the 6-12 month time scales. The short-term dryness was evident in such drought indicators as the SPI, soil moisture models, and Vegetation Health Index (VHI).
High Plains
Half an inch to an inch of precipitation fell in areas across Wyoming, Nebraska, and northern Kansas, with little to no precipitation occurring in the Dakotas and the High Plains of Montana. The precipitation was not enough to affect the D0-D1 lingering in northeast Kansas. Even though the week was drier than normal in north central Montana, the D0 there was trimmed to reflect a reassessment of the impact of precipitation in recent weeks. The D0-D1 in the Dakotas reflected lingering long-term dryness.
West
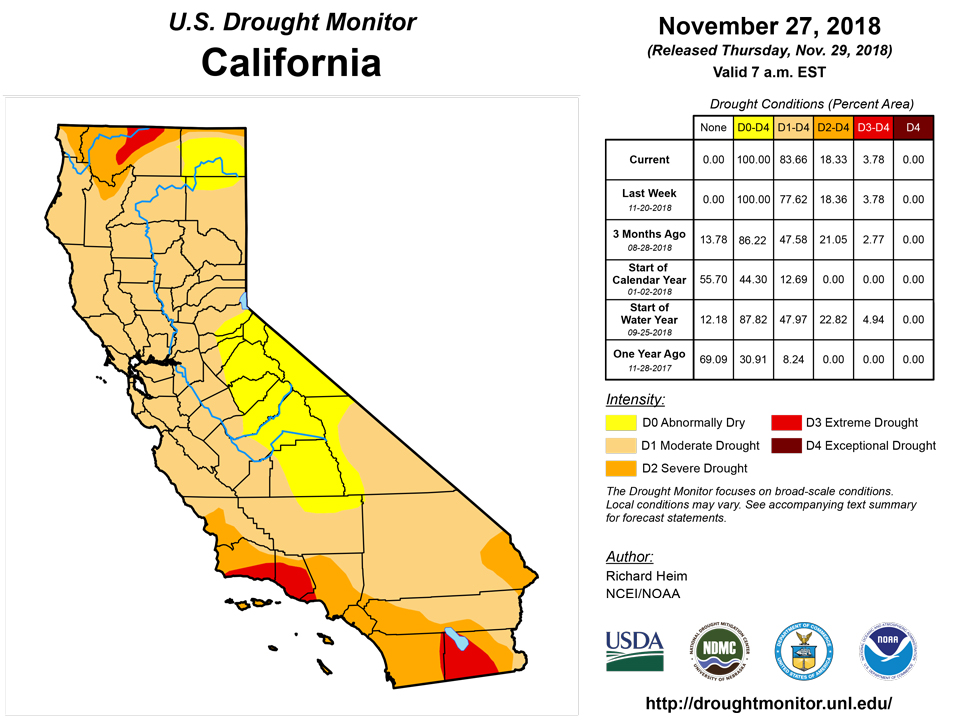
The Pacific weather systems brought beneficial rain and snow to coastal Washington and Oregon, and parts of central to northern California and the Sierra Nevada range. Widespread amounts of 2-4 inches occurred, with locally up to 5 inches in parts of northern coastal California and the Sierra, and 5-10 inches in the Olympic Peninsula of western Washington. Some parts of the Sierra Nevada measured more than a foot of new snow. The rain helped firefighters contain the Camp wildfire and snow improved mountain snowpack. But it wasn’t enough to overcome precipitation deficits which have built up over many months. While the week was wetter than normal in California, coastal Washington, and parts of Oregon, the water year to date (October 1-November 27), and even month to date (November 1-27), were still drier than normal in most areas. The precipitation was enough to prevent further expansion of drought areas, but not enough for improvement this week. Little to no precipitation fell further south. In southern California and southern Nevada, D1 expanded across parts of Nye, Esmeralda, and Inyo Counties where dryness this week and the last several weeks, as well as long-term dryness, were reflected in the SPI, SPEI, soil moisture models, and groundwater indices.
Half an inch to locally over 2 inches of precipitation fell across parts of the northern to central Rockies as the weather systems moved past, improving the snowpack half a foot to a foot in many places. In Colorado, D3 was trimmed in Routt County where recent precipitation has dropped SPIs and snowpack has improved. But further south, except for the northern Utah and Colorado mountains, little to no precipitation occurred across the Four Corners States. Some improvement occurred in southwest Arizona as a re-assessment of conditions. D1 was trimmed in Maricopa to Yuma Counties, and D2 reduced in La Paz County, where the heaviest rains fell over the last 2 months. The SPI shows wet conditions across much of Arizona, especially the southern portions, for the last 2 to 9 months and even 24 months. However, how and when the precipitation fell is very important. A lot of the rain fell in only a couple heavy rain events in the first 2 weeks of October. Much of the rain probably just ran off and didn’t get a chance to really contribute to the total moisture status, but it shows up in the SPI as wet. Also, the hot temperatures of recent months and years have enhanced evapotranspiration (ET), and this is reflected in very dry SPEI values, especially at time scales of 6 months and longer. The drought depiction in Arizona reflects these longer-term drought conditions.
Alaska, Hawaii, and Puerto Rico
No change was made to the depiction in Hawaii, Alaska, and Puerto Rico this week. The last 7 days were drier than normal across Puerto Rico. A few more streams were getting low at the 7-day time scale, but were still near normal at 28 days, and the current D0 covered the streamflow percentiles and soil moisture anomalies. It was another dry week across the Hawaiian Islands. Some stations were dry at the 30-day time scale on the Big Island and southern Maui, but all stations statewide were wet at 60+ days, and streams were mostly near or above normal. In Alaska, there was a mixed precipitation anomaly pattern this week in the southern areas, it was drier than normal in the southern interior and along the west coast, and wet in the north. The SPI showed some interior stations were dry for the last 90 days, but wet at longer time scales. Long-term dryness continued in the panhandle.
Looking Ahead
A Pacific weather system was moving across the West during Tuesday and Wednesday after the 12z cutoff time of the USDM, bringing more beneficial rain and snow to the drought areas of the Pacific coast to Great Basin; another was poised to move into the West Coast by the release time of this USDM report; a third is expected to bring more precipitation to the West over the weekend; while a fourth Pacific front is forecast to reach the coast by Tuesday morning. These weather systems will cross the Rockies and re-energize when they reach the Plains, picking up Gulf of Mexico moisture to bring precipitation to the central and eastern portions of the CONUS. The NWS Quantitative Precipitation Forecast (QPF) for November 28-December 4 calls for 3-6 inches of new precipitation across the Sierra Nevada to northern California, and in spotty areas of coastal Oregon and Washington, with 2+ inches in parts of the Midwest, in a couple strips across the Southeast, speckled across the Four Corners States, and in parts of southwest Alaska. Half an inch to 2 inches of precipitation is predicted for the Great Basin to central and southern Rockies, much of the Midwest, and parts of the Northeast. Outside these areas, 0.25 to 0.50 inch is expected to fall, except little to no precipitation is forecast for southern portions of the Southwest, much of Texas and Oklahoma, much of the northern Plains, and eastern Alaska. Above-normal temperatures will precede the fronts, especially in the eastern CONUS, with below-normal temperatures following them, spreading across most of the CONUS by the end of the period. The outlook for December 4-12 has colder-than-normal temperatures dominating the CONUS with warmer-than-normal temperatures across Alaska as a classic ridge/trough upper-level weather pattern sets up. Late in the period, warmer-than-normal air moves into the West as the trough migrates further east. Odds favor below-normal precipitation along the northern tier states and Alaska panhandle, and above-normal precipitation along the southern tier states, across much of the West, and the rest of Alaska.
Author(s):
Richard Heim, NOAA/NCEI
Dryness Categories
D0 Abnormally Dry—used for areas showing dryness but not yet in drought, or for areas recovering from drought.
Drought Intensity Categories
D1 Moderate Drought
D2 Severe Drought
D3 Extreme Drought
D4 Exceptional Drought
Drought or Dryness Types
S Short-Term, typically less than 6 months (e.g. agricultural, grasslands)
L Long-Term, typically greater than 6 months (e.g. hydrologic, ecologic)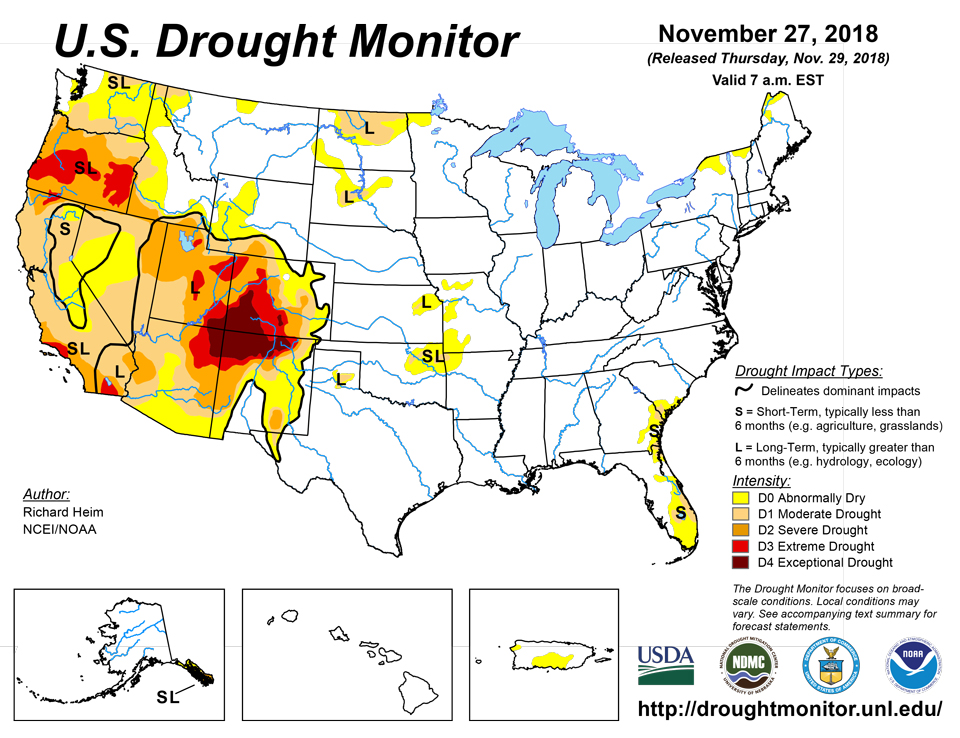
National Drought Mitigation Center

