California and National Drought Summary for February 19, 2019
Summary
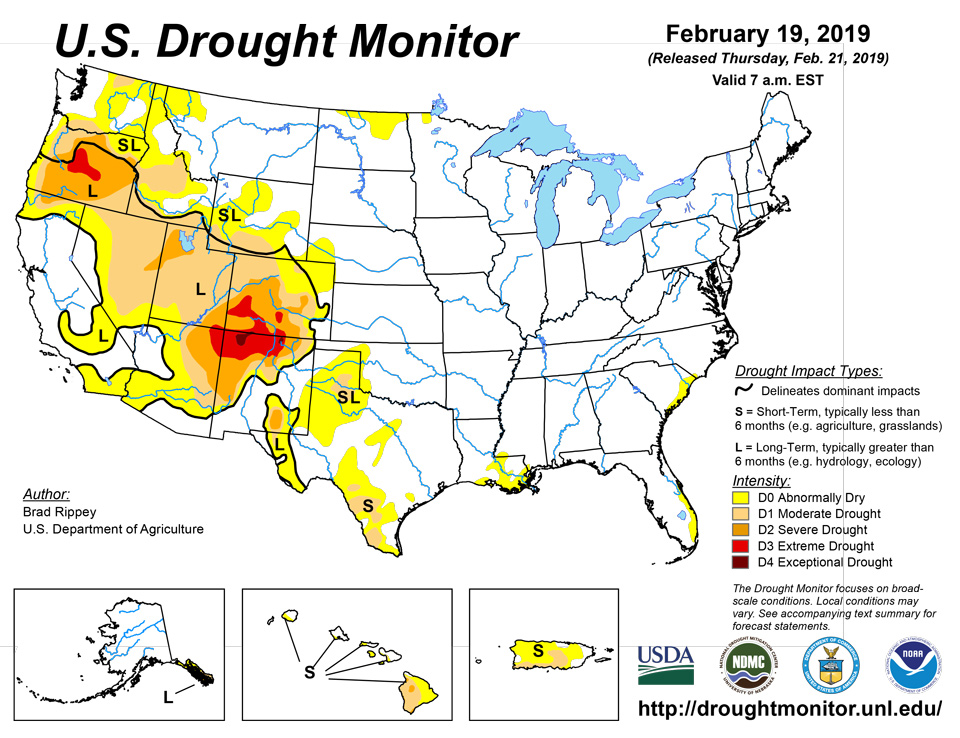
February 21, 2019 - Powerful, late-winter storms crossed the country, delivering periods of heavy precipitation in much of the West; significant snow across the North; and additional rain in the Ohio Valley and mid-South. Lowland flooding affected several river basins in the central and eastern Corn Belt, extending southward into the northern Mississippi Delta. Meanwhile, much of the North remained under a thick blanket of snow. Extremely heavy snow, totaling a foot or more, fell across portions of the upper Great Lakes region on February 12. The following day, snow spread into the Northeast. Later, snow returned across portions of the northern Plains and upper Midwest from February 14-16. Elsewhere, the average water content of the Sierra Nevada snowpack reached 30 inches by mid-February, according to the California Department of Water Resources. This was up from 17 inches at the beginning of the month—and exceeds the normal Sierra Nevada snow-water equivalency for an entire winter. California’s heaviest precipitation fell on February 13-14, resulting in flash flooding and debris flows. One of the most damaging mudslides struck in Sausalito, California, near San Francisco.
Northeast
Neither dryness nor drought exists in the Northeast at this time. During the 7-day drought-monitoring period, multiple storms delivered widespread rain and wintry precipitation. In terms of Northeastern precipitation, about the only thing lacking has been snow in some coastal and near-coastal locations. Through February 19, season-to-date snowfall in Boston, Massachusetts, totaled just 8.4 inches, or 27% of normal.
Southeast
Coastal southern Florida’s small area of abnormal dryness (D0) and moderate drought (D1) received additional rain, resulting in some further trimming of coverage. In fact, the elimination of Florida’s D1 leaves no drought east of the Mississippi River. Year-to-date rainfall through February 19 was above normal in Florida locations such as Vero Beach (5.06 inches, or 119% of normal) and Fort Pierce (4.89 inches, or 112%). Miami’s year-to-date rainfall, at 3.34 inches (106%), was also slightly above normal. Farther north, however, rainfall has been scarce so far in 2019 in coastal South Carolina and environs, where an area of abnormal dryness (D0) has developed. January 1 – February 19 rainfall totaled less than one-half of normal in South Carolina locations such as North Myrtle Beach (2.63 inches, or 44% of normal) and Charleston (1.94 inches, or 34%), and barely one-half of normal in Wilmington, North Carolina (3.35 inches, or 54%), and Savannah, Georgia (3.14 inches, or 56%).
South
Much of the South remains awash in precipitation. In fact, lowland flooding has been a problem in the mid-South, including the northern Mississippi Delta. Closer to the Gulf Coast, however, short-term dryness (D0) has developed in the last couple of weeks across portions of southern Louisiana and southern Mississippi. Since the beginning of the year, rainfall in Baton Rouge, Louisiana, has totaled just 4.08 inches, or 44% of normal. Farther west, abnormal dryness (D0) and pockets of moderate drought (D1) have been on the increase in Texas, except in the eastern part of the state. The lower Rio Grande Valley and portions of West Texas and the northern panhandle have been especially dry in recent weeks. From December 1, 2018 – February 19, 2019, rainfall in McAllen, Texas, totaled just 1.75 inches (57% of normal). In addition, McAllen posted a high temperature of 94 F on February 15. Elsewhere in Texas, year-to-date precipitation through February 19 totaled less than one-quarter of an inch in Childress (0.19 inch, or 13% of normal), Amarillo (0.16 inch, or 14%), Borger (0.11 inch, or 11%), Dalhart (0.08 inch, or 10%), and Lubbock (0.02 inch, or 2%). According to the U.S. Department of Agriculture, 28% of the winter wheat in Texas was in very poor to poor condition on February 17. On the same date, 28% of Texas’ rangeland and pastures were categorized as very poor to poor, while statewide topsoil moisture was 43% very short to short. Soils in Texas were especially dry on the northern and southern high plains (moisture was 80 and 84% very short to short, respectively), as well as the Lower Valley (80% very short to short).
Midwest
Lingering Midwestern dryness (D0) is limited to parts of northern Minnesota, which remains solidly frozen and in the midst of a persistently cold period. International Falls, Minnesota, east of the dry patches, has not been above the freezing mark (32 F) since January 7 and dipped as low as -46 F on January 27. Snow has piled up during the cold spell; February 19 depths included 13 inches in Grand Forks, North Dakota, and 21 inches in International Falls.
High Plains
There was no change to the depiction of abnormal dryness (D0) in North Dakota, which remains covered by snow and in the midst of a long-running cold spell. Large sections of the Great Plains remain free of dryness and drought, although short-term dryness previously resulted in the development of some D0 in western Nebraska and eastern Colorado. Information on long-term drought, which covers much of Colorado, appears in the paragraph devoted to the West.
West
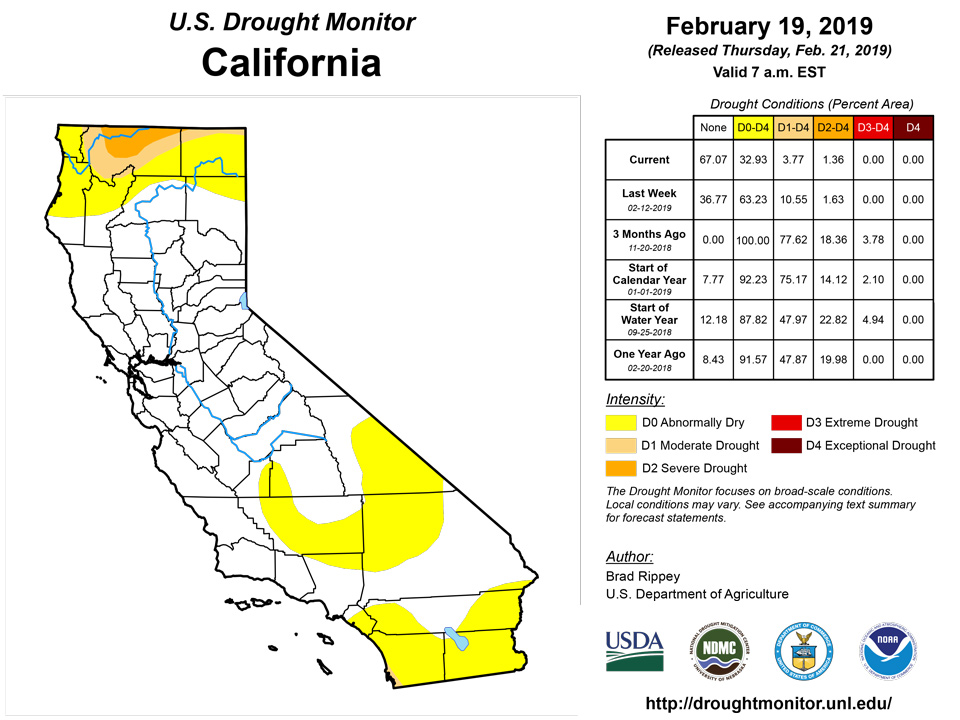
The West, in general, has experienced a cold, stormy February, leading to notable reductions in drought coverage and intensity. During the last several weeks, some degree of drought improvement has occurred in nearly all areas of the region. Some of the biggest improvements in snowpack and season-to-date precipitation have occurred in drought-affected areas stretching from the Pacific Northwest to the northern Rockies. River basin-average snowpack in the Cascades has mostly improved to 75 to 90% of average for this time of year, up from 50 to 75% a few weeks ago. Even greater improvements have occurred in central and southern Idaho, where current snowpack mostly ranges from 90 to 125% of average. Farther south, significant snow has also recently fallen across the core severe to exceptional drought (D2 to D4) areas in the Four Corners region, with more improvement noted in Colorado and Utah than areas farther south. In addition, New Mexico also continues to suffer from critically low reservoir levels; statewide storage on February 1 was just 41% of average, compared to 70% at the same time a year ago. Farther west, however, early- to mid-February precipitation pounded California, ensuring an above-average Sierra Nevada snowpack but triggering flash flooding and mudslides. Precipitation hit southern California especially hard on February 14, when Palomar Mountain reported its wettest 24-hour period on record (10.10 inches; previously, 9.58 inches on March 1, 1991). Palm Springs, California, received 3.69 inches on February 14, accounting for 64% of its normal annual precipitation.
Alaska, Hawaii, and Puerto Rico
Mild weather covered the Alaskan mainland. Meanwhile, cold, dry conditions dominated the southeastern part of Alaska, where no changes were made to the existing areas of long-term dryness (D0) and moderate to severe drought (D1 to D2). Farther south, below-normal temperatures engulfed Hawaii, accompanied by periods of windy, stormy weather that included snowfall on the higher elevations of Maui (e.g. Haleakala) and the Big Island (e.g. Mauna Loa and Mauna Kea). The cumulative effect of several cold weather systems has been to reduce the intensity and coverage of Hawaiian drought. Reductions of approximately one category (removal of abnormal dryness, D0, or a change from moderate drought, D1, to D0) occurred across much of Kauai, Oahu, and Maui Counties. The Big Island saw a reduction in coverage of moderate to severe drought (D1 and D2), especially in windward locations. Despite the cooler, wetter Hawaiian weather, Big Island pastures in some of the D2 areas have been slow to recover. Meanwhile in Puerto Rico, the depiction of abnormal dryness (D0) and moderate drought (D1) was unchanged. The core drought area, stretching from the central interior to parts of the southern coast, continued to experience below-normal rainfall on a variety of short-term time scales.
Looking Ahead
A steady parade of storms will continue to traverse the country, delivering periods of rain and snow to the West; additional snowfall in the upper Midwest; and torrential rainfall across the interior Southeast, northward into the Ohio Valley. The largest storm during the next 5 days will emerge from the Southwest on February 22-23 and cross the upper Midwest on February 23-24. Five-day rainfall totals could reach 2 to 4 inches or more across the mid-South, while blizzard conditions could engulf the upper Midwest and neighboring regions, especially on February 23-24. In contrast, little or no precipitation will occur during the next 5 days in the lower Rio Grande Valley.
The NWS 6- to 10-day outlook for February 26 – March 2 calls for the likelihood of near- or below-normal temperatures nationwide, except for warmer-than-normal weather across the lower Southeast. Temperatures will remain significantly below average across large sections of the northern, western, and central U.S. Meanwhile, near- or above-normal precipitation across most of the country should contrast with drier-than-normal conditions from southern California to the southern Plains and parts of the mid-South.
Author(s):
Brad Rippey, U.S. Department of Agriculture
Dryness Categories
D0 Abnormally Dry—used for areas showing dryness but not yet in drought, or for areas recovering from drought.
Drought Intensity Categories
D1 Moderate Drought
D2 Severe Drought
D3 Extreme Drought
D4 Exceptional Drought
Drought or Dryness Types
S Short-Term, typically less than 6 months (e.g. agricultural, grasslands)
L Long-Term, typically greater than 6 months (e.g. hydrologic, ecologic)