California and National Drought Summary for February 26, 2019
Summary
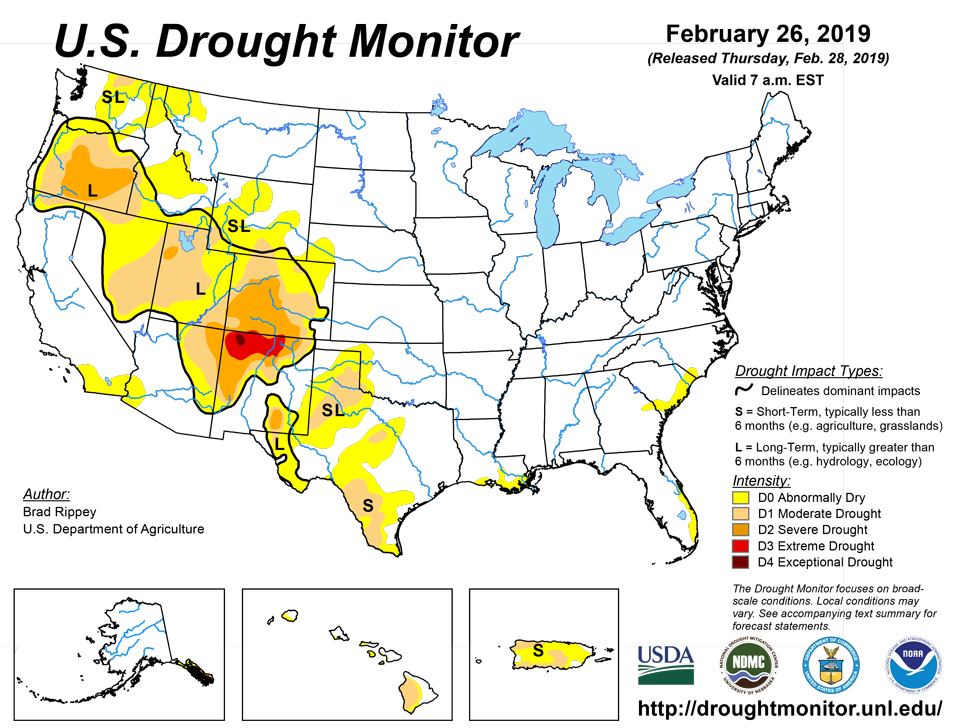
February 28, 2019 - A pair of late-winter storms blanketed large areas of the West with snow, easing drought; bolstering high-elevation snowpack; and further improving spring and summer runoff prospects. The first storm system, which swept across the Southwest from February 20-22, produced heavy precipitation in core drought areas of the Four Corners States and deposited measurable snow in locations such as Las Vegas, Nevada, and Tucson, Arizona. The second storm—in actuality a series of disturbances—began to affect parts of the Northwest during the weekend of February 23-24 and later delivered another round of heavy precipitation across northern California. Farther east, drenching rain resulted in aggravated and expanded flooding from the northern Mississippi Delta into the southern Appalachians. Rainfall totaled 4 to 12 inches or more in the flood-affected area, with some of the highest amounts occurring in the Tennessee Valley. On February 23-24, thunderstorms spawned several tornadoes in Alabama, Georgia, and Mississippi. Farther north, a blizzard briefly engulfed portions of the northern and central Plains and upper Midwest. The short-lived but fierce storm produced several inches of snow, driven by wind gusts in excess of 60 mph, mainly on February 23-24. High winds also raked the southern Plains—without the benefit of significant precipitation—compounding the effects of short-term dryness on winter wheat and rangeland health.
Northeast
Neither dryness nor drought exists in the Northeast. Snow has been lacking, however, in some northern Atlantic locations. For example, season-to-date snowfall through February 26 in Boston, Massachusetts, totaled just 10.5 inches, or 31% of normal.
Southeast
Despite record-setting warmth, there was no change to Florida’s depiction of abnormal dryness (D0). Outside of Florida’s existing dry area, Gainesville tied a monthly record with a high of 89°F on February 21, and surpassed that mark with a high of 91°F on February 23. Gainesville’s previous earliest 90-degree reading had occurred on March 10, 1974. Similarly, Vero Beach—within Florida’s D0 area—reported a monthly record high of 90°F on February 24. Florida’s D0 area will be monitored for possible drought development, as Vero Beach’s February 1-26 rainfall totaled just 1.03 inches (42% of normal). Farther north, warm, mostly dry weather prevailed in the abnormally dry (D0) area centered over the South Carolina coast. January 1 – February 26 rainfall totaled less than one-half of normal in South Carolina locations such as North Myrtle Beach (3.01 inches, or 44% of normal) and Charleston (2.35 inches, or 36%), and barely one-half of normal in Wilmington, North Carolina (3.72 inches, or 52%), and Savannah, Georgia (3.43 inches, or 55%). Given the ongoing warmth and dryness, D0 was expanded farther into southeastern North Carolina and southeastern Georgia.
South
Some of the heavy rain that fell across the mid-South grazed the central Gulf Coast region, resulting in a slight reduction in the coverage of abnormal dryness (D0). Farther west, abnormal dryness (D0) and moderate drought (D1) was broadly expanded across western and southern Texas, as well as southwestern Oklahoma. According to the U.S. Department of Agriculture, 21% of the winter wheat in Texas was in very poor to poor condition on February 24. On the same date, 28% of Texas’ rangeland and pastures were categorized as very poor to poor, while statewide topsoil moisture was 42% very short to short. Topsoils were especially dry (moisture was 86% very short to short) on Texas’ southern high plains and in the lower Rio Grande Valley (79% very short to short). From December 1, 2018 – February 26, 2019, rainfall in McAllen, Texas, totaled just 1.81 inches (55% of normal). Elsewhere in Texas, year-to-date precipitation through February 19 totaled less than one-quarter of an inch in Childress (0.19 inch, or 11% of normal), Dalhart (0.08 inch, or 9%), and Lubbock (0.04 inch, or 3%).
Midwest
Ongoing stormy weather continued to affect the north-central U.S., setting a variety of February and all-time monthly snowfall records. It has already become the snowiest month on record in Wisconsin locations such as Wausau (48.6 inches through February 26; previously, 37.6 inches in December 2008) and Eau Claire (50.7 inches; previously, 35.2 inches in January 1929). Previously dry areas in Minnesota have received enough precipitation in recent months to eradicate D0. Abnormal dryness (D0) was also removed from North Dakota, following a protracted period of below-normal temperatures and frequent snowfall events. The drought situation for Wyoming and Colorado will be covered in the section devoted to the West.
West
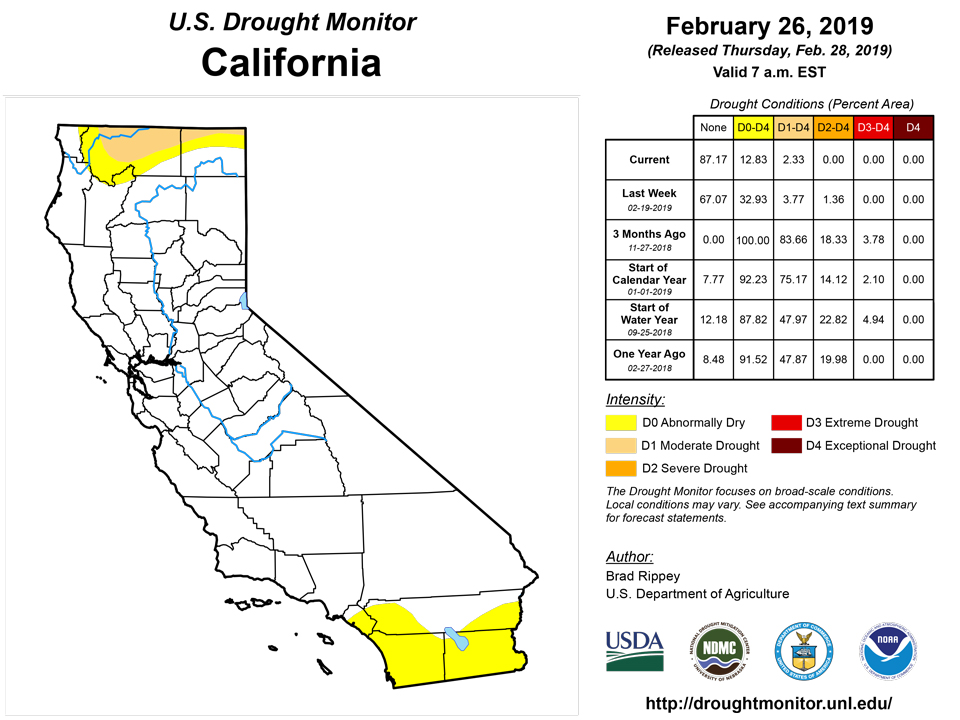
As described in the summary section, major storm systems affected core drought areas in Oregon and the Four Corners region, respectively, leading to locally significant reductions in the coverage of dryness (D0) and moderate to exceptional drought (D1 to D4). By late February, nearly all Western river basins, except a few in southern New Mexico, are experiencing near- to above-average snowpack. In addition, the recent spate of cold weather has maximized snow accumulations, even at middle and lower elevations. According to the California Department of Water Resources, the average water content of the Sierra Nevada snowpack by February 26 stood at 36 inches—150% of average for the date and approximately 130% of average peak value. In Oregon, extreme drought (D3) was eradicated, while substantial reductions were realized in the coverage of moderate to severe drought (D1 to D2). Drought was nearly pushed out of California, with only a lingering sliver of moderate drought (D1) along the Oregon border. Major improvements were also introduced in parts of Nevada, Idaho, Utah, Colorado, and Arizona. Extreme drought (D3) was nearly eased out of southern Colorado, leaving a remnant area of extreme to exceptional drought (D3 to D4) across northern New Mexico. In another example of a major reduction, the former large Western area of moderate drought (D1) was split into three pieces, with cuts across Nevada/Idaho, and Utah/Wyoming/Colorado, respectively.
Alaska, Hawaii, and Puerto Rico
Small increases in the coverage of moderate to severe drought (D1 to D2) were introduced in southeastern Alaska, where colder- and drier-than-normal conditions persisted. Winter precipitation deficits continued to increase across the region, leading below-average snowpack. In addition, low reservoir levels—in part due to longer-term precipitation deficits across southeastern Alaska—continue to result in concerns related to hydroelectric power generation and an increased reliance on diesel fuel. Meanwhile in Hawaii, heavy rain fell early in the drought-monitoring period across Maui and the Big Island. The Hawaiian rain led to further reductions in the coverage of abnormal dryness (D0) and moderate drought (D1) in southern Maui, as well as the elimination of severe drought (D2) from the Big Island. In addition, the Big Island’s coverage of dryness (D0) and moderate drought (D1) was reduced, amid the ongoing wet spell. Farther east, drier-than-normal conditions continued to dominate Puerto Rico on time scales ranging from a few days to 6 months. The most significant Puerto Rican drought (D1) stretched along much the southern coast and into portions of the interior. A new area of moderate drought (D1) was introduced in northwestern Puerto Rico, courtesy of low streamflow and rainfall deficits at various time scales. Reports from the island indicate a recent increase in grassfires, especially in southern drought areas, as well as local concerns related to low aquifers and low reservoir levels.
Looking Ahead
The storm system currently affecting the West will lose some organization while traversing the central and eastern U.S. Nevertheless, 5-day rainfall totals could reach 1 to 3 inches or more in the Southeast, while periods of generally light snow will affect portions of the Plains, Midwest, and Northeast. During the weekend and early next week, a strong surge of cold air will engulf the Plains and Midwest, with sub-zero temperatures expected as far south as northern sections of Kansas and Missouri. In addition, sub-freezing temperatures could reach into the Deep South. Farther west, a new storm system should arrive in California during the weekend, with wintry precipitation rapidly spreading eastward across portions of the southern U.S. by early next week. Outside of the contiguous U.S., Alaska’s drought areas will continue to experience cold, mostly dry weather during the next few days, while locally heavy showers over Hawaii’s Big Island will shift east of the state by late in the week. Elsewhere, conditions over Puerto Rico will favor a slight increase in shower activity, although no widespread, organized rainfall is expected into early next week.
The NWS 6- to 10-day outlook for March 5 – 9 calls for the likelihood of colder-than-normal conditions nationwide, except for near-normal temperatures in southern Florida and above-normal temperatures in parts of the Southwest. Meanwhile, wetter-than-normal weather from California into the middle Mississippi Valley should contrast with below-normal precipitation in the upper Great Lakes region and most areas east of the Mississippi River.
Author(s):
- Brad Rippey, U.S. Department of Agriculture
Dryness Categories
D0 Abnormally Dry—used for areas showing dryness but not yet in drought, or for areas recovering from drought.
Drought Intensity Categories
D1 Moderate Drought
D2 Severe Drought
D3 Extreme Drought
D4 Exceptional Drought
Drought or Dryness Types
S Short-Term, typically less than 6 months (e.g. agricultural, grasslands)
L Long-Term, typically greater than 6 months (e.g. hydrologic, ecologic)