


Employers add 34,500 nonfarm jobs, current expansion sets new record
September 20, 2019 - SACRAMENTO – California’s unemployment rate held at a record low 4.1 percent in August while the state’s employers added 34,500 nonfarm payroll jobs, according to data released today by the California Employment Development Department (EDD) from two surveys. The job gains in August contribute to a record employment expansion in California of 114 months, surpassing the expansion of the 1960s. California has gained 3,330,100 jobs since the economic expansion began in February 2010, accounting for more than 15 percent of the nation’s job gains over the expansion.
California’s Labor Market, by the Numbers...
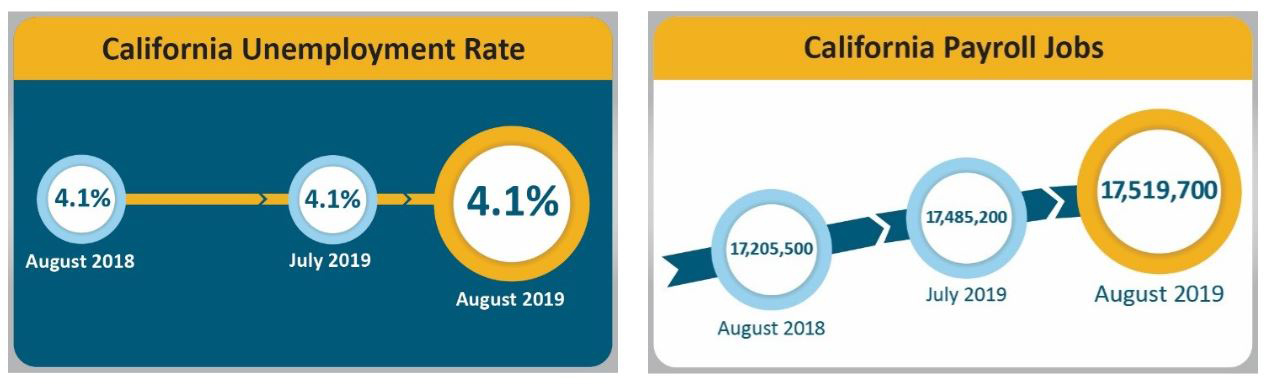
- The state’s unemployment rate held at 4.1 percent1 in August, once again tying the record low unemployment rate first set in July through December 2018.
- August’s 34,500 nonfarm payroll gain extended California’s current employment expansion to an all-time record of 114 months, breaking the mark previously held by the expansion in the 1960s. Gains were mostly in the government, educational and health services, and leisure and hospitality industry sectors.
- California added an average 29,200 jobs2 per month over the entire 114-month-long expansion - far more than the 8,000-9,000 jobs needed monthly to match labor force growth.
- While the current record expansion reflects broad-based job gains across multiple industries, the August 1960 - December 1969 expansion was primarily fueled by manufacturing, particularly in aerospace, and higher population growth (approx. 2.7 percent annual growth in the 1960s compared to 0.8 percent currently).
1. The unemployment rate comes from a federal survey of 5,100 California households.
2. The nonfarm payroll job numbers come from a separate federal survey of 80,000 California businesses.
Data Trends about Jobs in the Economy
Total Nonfarm Payroll Jobs (Comes from a monthly survey of approximately 80,000 California businesses that estimates jobs in the economy – seasonally adjusted)
- Month-over – Total nonfarm jobs in California’s 11 major industries totaled 17,519,700 in August – a net gain of 34,500 jobs from July. This followed a revised gain of 16,200 jobs in July.
- Year-over – Total nonfarm jobs increased by 314,200 jobs (a 1.8 percent increase) from August 2018 to August 2019 compared to the U.S. annual gain of 2,074,000 jobs (a 1.4 percent increase).
 EEOmail@edd.ca.gov or call toll free 1-866-490-8879." style="box-sizing: border-box; vertical-align: middle; border-style: none; width: 1100px; max-width: 1100px;">
Total Farm jobs – The number of jobs in the agriculture industry increased by 1,700 jobs from July to 427,600. The agricultural industry has added 3,600 farm jobs since August 2018.
Data Trends about Workers in the Economy
Employment and Unemployment in California (Based on monthly federal survey of 5,100 California households which focuses on workers in the economy)
- Employed – The number of Californians holding jobs in August was 18,589,300, a increase of 5,500 from July and down 34,500 from the employment total in August of last year.
- Unemployed – The number of unemployed Californians was 790,800 in August, a decrease of 13,200 over the month and down by 7,000 compared with August of last year.

Unemployment Insurance Claims (not seasonally adjusted) In related data that figures into the state’s unemployment rate, there were 309,691 people receiving Unemployment Insurance benefits during the survey week in August compared to 308,212 in July and 306,175 people in August 2018. Concurrently, 34,775 people filed new claims in August which was a month-over decrease of 4,715.

| COUNTY | LABOR FORCE | EMPLOYMENT | UNEMPLOYMENT | RATE |
|---|---|---|---|---|
| STATE TOTAL | 19,424,900 | 18,617,500 | 807,400 | 4.2% |
| ALAMEDA | 853,400 | 826,900 | 26,500 | 3.1% |
| ALPINE | 490 | 470 | 30 | 5.7% |
| AMADOR | 15,220 | 14,650 | 570 | 3.7% |
| BUTTE | 101,300 | 96,300 | 4,900 | 4.9% |
| CALAVERAS | 21,800 | 21,000 | 810 | 3.7% |
| COLUSA | 11,240 | 10,290 | 960 | 8.5% |
| CONTRA COSTA | 567,600 | 549,200 | 18,300 | 3.2% |
| DEL NORTE | 9,910 | 9,370 | 550 | 5.5% |
| EL DORADO | 91,800 | 88,400 | 3,300 | 3.6% |
| FRESNO | 454,800 | 424,800 | 30,000 | 6.6% |
| GLENN | 12,880 | 12,090 | 790 | 6.1% |
| HUMBOLDT | 62,600 | 60,300 | 2,300 | 3.7% |
| IMPERIAL | 71,600 | 55,800 | 15,800 | 22.1% |
| INYO | 8,860 | 8,570 | 290 | 3.3% |
| KERN | 393,700 | 364,500 | 29,200 | 7.4% |
| KINGS | 58,200 | 54,100 | 4,000 | 7.0% |
| LAKE | 29,970 | 28,630 | 1,340 | 4.5% |
| LASSEN | 9,840 | 9,420 | 420 | 4.3% |
| LOS ANGELES | 5,101,800 | 4,861,400 | 240,400 | 4.7% |
| MADERA | 61,500 | 57,600 | 4,000 | 6.5% |
| MARIN | 141,900 | 138,500 | 3,400 | 2.4% |
| MARIPOSA | 8,260 | 7,960 | 310 | 3.7% |
| MENDOCINO | 39,780 | 38,350 | 1,430 | 3.6% |
| MERCED | 116,600 | 108,200 | 8,400 | 7.2% |
| MODOC | 3,220 | 3,040 | 180 | 5.7% |
| MONO | 9,100 | 8,790 | 300 | 3.3% |
| MONTEREY | 232,600 | 222,800 | 9,800 | 4.2% |
| NAPA | 75,300 | 73,300 | 2,000 | 2.7% |
| NEVADA | 49,280 | 47,660 | 1,620 | 3.3% |
| ORANGE | 1,611,800 | 1,563,400 | 48,400 | 3.0% |
| PLACER | 185,800 | 179,800 | 6,100 | 3.3% |
| PLUMAS | 8,290 | 7,810 | 480 | 5.8% |
| RIVERSIDE | 1,093,500 | 1,042,800 | 50,800 | 4.6% |
| SACRAMENTO | 713,100 | 685,500 | 27,600 | 3.9% |
| SAN BENITO | 31,100 | 29,600 | 1,400 | 4.6% |
| SAN BERNARDINO | 962,400 | 922,800 | 39,600 | 4.1% |
| SAN DIEGO | 1,596,900 | 1,543,300 | 53,600 | 3.4% |
| SAN FRANCISCO | 586,900 | 573,600 | 13,300 | 2.3% |
| SAN JOAQUIN | 324,500 | 305,800 | 18,800 | 5.8% |
| SAN LUIS OBISPO | 137,200 | 133,000 | 4,200 | 3.1% |
| SAN MATEO | 463,500 | 453,600 | 10,000 | 2.1% |
| SANTA BARBARA | 217,700 | 210,300 | 7,400 | 3.4% |
| SANTA CLARA | 1,063,100 | 1,035,200 | 27,900 | 2.6% |
| SANTA CRUZ | 143,800 | 138,200 | 5,600 | 3.9% |
| SHASTA | 74,200 | 70,900 | 3,300 | 4.4% |
| SIERRA | 1,340 | 1,280 | 60 | 4.6% |
| SISKIYOU | 17,750 | 16,780 | 970 | 5.5% |
| SOLANO | 207,300 | 199,300 | 8,000 | 3.8% |
| SONOMA | 263,700 | 256,500 | 7,200 | 2.7% |
| STANISLAUS | 245,900 | 231,600 | 14,300 | 5.8% |
| SUTTER | 46,600 | 43,800 | 2,800 | 6.0% |
| TEHAMA | 25,720 | 24,310 | 1,410 | 5.5% |
| TRINITY | 4,950 | 4,730 | 220 | 4.5% |
| TULARE | 205,900 | 186,900 | 19,000 | 9.2% |
| TUOLUMNE | 21,740 | 20,810 | 920 | 4.3% |
| VENTURA | 417,300 | 401,200 | 16,100 | 3.9% |
| YOLO | 109,200 | 105,000 | 4,200 | 3.9% |
| YUBA | 29,100 | 27,300 | 1,700 | 6.0% |
Source: EDD
