


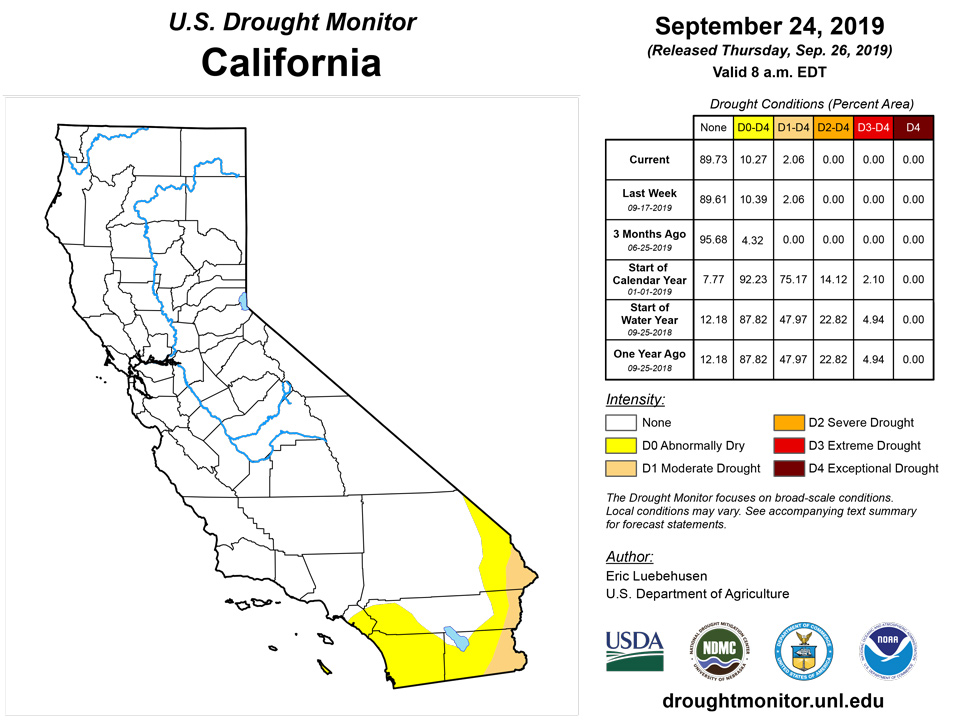
California and National Drought Summary for September 24, 2019
Summary
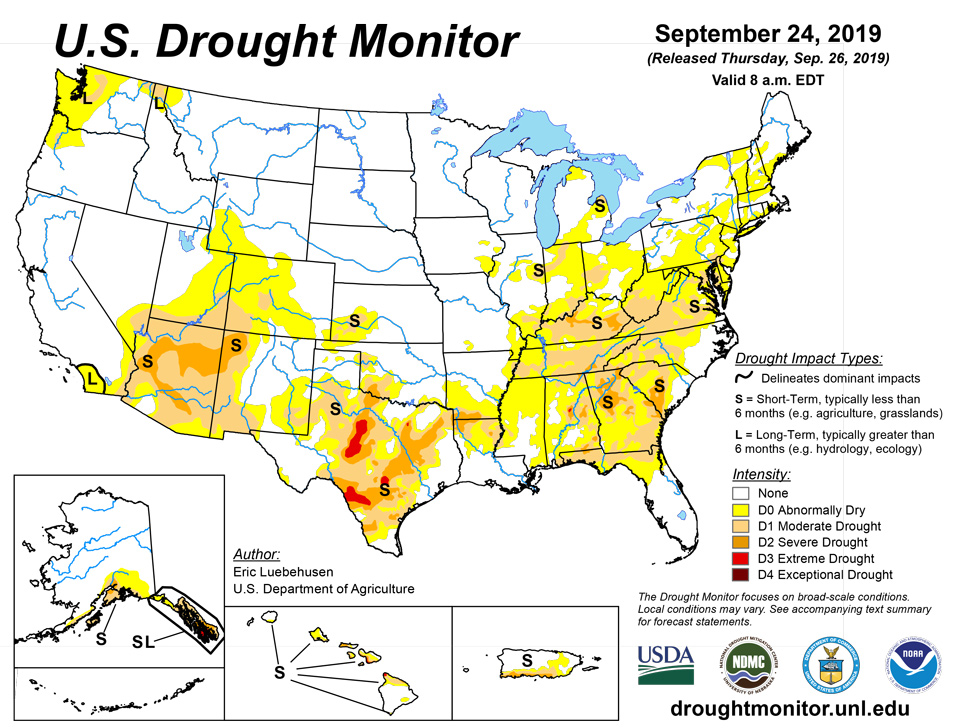
September 26, 2019- Rapidly intensifying “flash drought” — attributed in part to extreme late-summer heat — continued to afflict many areas from the lower Midwest and Mid-Atlantic States to the Gulf Coast. Conversely, heavy to excessive rainfall associated with the remnants of Tropical Storm Imelda eradicated drought but caused locally catastrophic flooding in southeastern Texas and western Louisiana. Farther west, late-season showers on the heels of an abysmal Southwestern monsoon (to-date) helped stem drought increases in the Four Corners region, while rain and mountain snow further reduced lingering drought in the northwestern quarter of the nation. Meanwhile, additional moderate to heavy rain eased or alleviated dryness and drought from the Northwest into the Great Lakes. Outside of the lower 48, additional heavy rainfall eased lingering drought and dryness in south-central Alaska. Elsewhere, short-term drought persisted across the Hawaiian Islands, while Puerto Rico was mostly dry; rain arrived in Puerto Rico after the monitoring period ended (Tuesday morning).
Northeast
Despite the arrival of somewhat cooler conditions in parts of the Northeast, the overall trend of warmer- and drier-than-normal weather continued to exacerbate short-term dryness and drought in the region. Abnormal Dryness (D0) and Moderate Drought (D1) increased from West Virginia and Maryland northeastward into southern New England. Acute short-term rainfall deficits (30-day rainfall totaling 10 to 50 percent of normal, locally less than 5 percent in southern portions of the region) led to the expansion of D0, while similar deficits out to 60 days—coupled with vegetation stress and declining streamflows—led to a notable increase of D1 across the southern tier of the region.
Southeast
Another round of late-summer heat and persistent acute short-term dryness led to a sharp increase in drought intensity and coverage. Triple-digit daytime highs and pronounced short-term rainfall deficits (60-day rainfall totaling less than 40 percent of normal) heightened evapotranspiration rates and soil moisture losses, resulting in quickly escalating drought impacts (often referred to as a “flash drought”.) It should be noted that “flash drought” impacts often materialize more quickly than the precipitation data indicates due to the heat. For this weeks’ analysis, the expansion of D0 (Abnormal Dryness) and Moderate to Severe Drought (D1-D2) was driven in large part by guidance from local experts, impact reports from observers, as well as temperature- and rainfall-driven data products which focused on the past 30 to 90 days. Increases in D0, D1, and D2 were most pronounced in northern portions of the region (from northern Alabama into central North Carolina) as well as from northern Florida (including the panhandle) into southern Georgia. Severe Drought areas (D2) are mostly coincident with 90-day rainfall less than half of normal, with some locales lower than one third. Furthermore, a small pocket of D3 (Extreme Drought) in northeastern Alabama is likely a harbinger of things to come if rain does not materialize soon. As of September 22, state-wide average topsoil moisture ratings (according to USDA-NASS) continued to tank; double-digit jumps week to week in percent rated poor to very poor were noted in North Carolina (60 percent poor to very poor, up 18 percentage points from last week), South Carolina (77 percent, up 25 points), Georgia (88 percent, up 15 points), and Alabama (highest in the region at 91 percent poor to very poor, up 18 percentage points from last week. Even Florida noted a 12 point jump from last week, and was now averaging 37 percent poor to very poor.
South
Highly variable conditions were observed across the South, with intense late-summer heat and acute short-term dryness in southwestern and northeastern portions of the region contrasting with heavy to excessive rainfall across the west-central Gulf Coast and from western Texas northeastward into central and southern Oklahoma. Tropical Storm Imelda moved slowly ashore near Freeport, Texas, drifting northward while producing prodigious rainfall totals (20-30 inches, locally more) south and east of Houston. Heavy rain (2-8 inches) was also noted further inland across eastern Texas, western Louisiana, and southeastern Oklahoma, easing or alleviating Abnormal Dryness (D0) as well as Moderate to Severe Drought (D1 and D2). Farther west, widespread heavy showers (1-5 inches, locally more) from Texas’ Big Bend northeastward into central and southeastern Oklahoma (a peak value of 7.66 inches was noted in Antlers, OK) likewise supported aggressive reductions to drought intensity and coverage.
Conversely, excessive heat (daytime highs approaching or topping 100°F) and pronounced short-term dryness (60-day rainfall totaling locally less than 20 percent of normal) heightened evapotranspiration rates and soil moisture losses, resulting in quickly escalating drought impacts (often referred to as a “flash drought”.) It should be noted that “flash drought” impacts often arise more quickly than the rainfall data would suggest due to the accompanying heat. For this week’s analysis, the expansion of D0 (Abnormal Dryness) as well as Moderate (D1) to Extreme Drought (D3) was driven by guidance from local experts, impact reports from observers, as well as temperature- and rainfall-driven data products which focused on the past 60 to 90 days. Increases in drought were most pronounced from the Rio Grande toward Dallas, Texas, and from the central Delta into Tennessee. State-wide average topsoil moisture was rated more than 70 percent short to very short (according to USDA-NASS) as of September 22 in Arkansas (78 percent poor to very poor), Mississippi (83 percent), and Tennessee (89 percent, a 14-point jump over last week).
Midwest
Additional reductions to drought intensity and coverage across the northern half of the region contrasted with rapidly intensifying and expanding drought in the south. From Iowa into Michigan (including northern portions of Illinois and Indiana), another widespread soaking rainfall (1-6 inches) eased or eradicated lingering Abnormal Dryness (D0) and Moderate Drought (D1). Conversely, temperatures in the middle 90s coupled with acute short-term moisture deficits (60-day rainfall locally less than 30 percent of normal) led to an expansion of D0 and D1 as well as the introduction of Severe Drought (D2), most notably from southern Illinois eastward into Kentucky and neighboring portions of Indiana and Ohio. State-wide average topsoil moisture was rated 55 percent short to very short (according to USDA-NASS) as of September 22 in both Indiana and Ohio, and 86 percent poor to very poor in Kentucky. Reports from the field indicate Kentucky is experiencing the same type of “flash drought” being observed across much of the south; the impacts of “flash drought” often occur more quickly than the objective data indicates.
High Plains
Most of the region remained free of drought, as above-normal temperatures in the east contrasted with cool albeit dry conditions in the west. However, Abnormal Dryness (D0) and Moderate Drought (D1) were increased in parts of southwestern Kansas as well as south-central and western Colorado due to increasingly dry conditions over the past 90 days (30-50 percent of normal).
West
Moderate to heavy showers arrived in the Southwest, while unsettled, cool conditions continued across the Northwest.
Showers and thunderstorms (1-4 inches, locally more) associated in part with moisture from the remnants of Hurricane Lorena arrived in central Arizona, helping to stem further drought increases (at least temporarily) from the abysmal Southwestern monsoon season-to-date. Despite this week’s showers, 6-month rainfall has totaled a meager 10 to 50 percent of normal, with higher totals (70-100 percent of normal) noted in the mountains of central Arizona. The Southwestern monsoon typically runs from June 15-September 30 and accounts for up to half the total annual precipitation in some parts of the Southwest.
Farther north, near- to below-normal temperatures as well as another round of moderate to heavy rain (1-3 inches) from the Pacific Northwest into the northern Rockies spurred additional reductions of Abnormal Dryness (D0) and Moderate Drought (D1). At week’s end, D0 and D1 were limited to locales still reporting longer-term precipitation deficits (12-month precipitation averaging near 75 percent of normal or less).
Alaska, Hawaii, and Puerto Rico
The recent wet weather trend continued in Alaska, with this past week featuring 1 to 3 inches of rain over many of the state’s primary drought areas. 7-day rainfall totaled as much as 3.92 inches on the Kenai Peninsula, pushing the two-week rainfall to more than 8 inches locally. While more rain will be needed to fully eradicate the Alaska’s Moderate to Extreme Drought (D1-D3), the recent wet weather has eased the drought coverage and intensity in the south and southwest. In Hawaii, portions of the Big Island and Maui remained very dry. In particular, South Point on the Big Island was increased to Severe Drought (D2) to reflect the very poor vegetation health signal depicted in satellite imagery. It was a quiet week in Puerto Rico, with heavy showers approaching after the end of the drought monitor period (ending 12z, Tuesday morning).
Pacific Islands
The weather pattern during this USDM week (9/18/19-9/24/19) was dominated by a two main features: a surface ridge which continued across southern portions of Micronesia for most of the week, and a monsoon trough during the last half of the week which stretched from the Marianas eastward to the northern Marshall Islands (RMI), keeping just north of the Federated States of Micronesia (FSM). Weak circulations populated the monsoon trough, while an upper-level low or trough near the Marianas enhanced precipitation. South of the equator, a strong high pressure ridge kept its grip over the Samoan Islands, keeping a surface trough to the north of the islands for most of the week; the trough advanced to the islands as the ridge shifted away at the end of the week.
Satellite-based estimates of 7-day precipitation (QPE) showed areas of 2+ inches of rain across parts of the Marianas and northern RMI, and brushing the northern edge of Chuuk and Pohnpei States and northwest Yap State. The QPE tapered off to no rain for the week across southern portions of Micronesia. A band of 2+ inches of rain was evident north and east of the Samoan Islands, with 0.5 to 1.0 inch brushing American Samoa, and mostly no rain to the southwest.
With 0.86 inch of rain, Palau had less than the 2-inch weekly minimum for a second consecutive week, but previous weeks and months were wet, so D-Nothing continued.
The combination of monsoon trough, surface disturbances, and upper-level low/trough gave the Marianas another wet week (more than the 1-inch weekly minimum needed to meet most water needs). Weekly rainfall totals ranged from 2.45 inches at Dededo and 2.53 inches at Guam to 3.66 inches at Saipan and 4.13 inches at Rota. The ASOS station at Saipan recorded 4.52 inches for the week and the automated NPS station at Saipan recorded 3.14 inches. With well over a foot of rain for the month so far at the regular-reporting stations, D-Nothing continued region-wide.
In the FSM, Fananu has been missing for the last two weeks, and Ulithi continues to be missing, so an analysis could not be made for these two locations. Yap had more than the 2-inch weekly minimum needed for most water needs (2.62 inches), but the rest of the stations in the FSM were dry, some with no rain reported for the week. The zero-inch stations included Kosrae, Kapingamarangi, Nukuoro, and Pingelap. However, D-Nothing continued across the FSM because this was only the second consecutive dry week, at the longest, and previous weeks and months were wet. But if the dry conditions at the southern stations continue, D0-S may be considered in the next week or two.
In the RMI, eastern stations were wet (Utirik 3.57 inches, Wotje 2.08, Mili 2.09) while other stations were dry (less than the 2-inch weekly minimum). Ailinglapalap and Jaluit measured no rain this week. With preliminary reports of some rain catchments getting very low, D2-SL continued at Jaluit, and since this was only the second consecutive dry week at Ailinglapalap, D-Nothing continued there for now. But with zero inches measured this week and 4 of the last 5 weeks dry, if dry conditions continue for the next week or two, D0-S may be re-introduced at Ailinglapalap. D1-SL continued at Wotje this week. With 7 of the last 8 weeks wet and 11.33 inches of rain so far this month, Utirik had the sixth wettest September (so far), compared to 15 full Septembers, and the third wettest (out of 13 years) August-September, so the USDM status was changed from D0-L to D-Nothing at Utirik. With 0.74 inch of rain this week, the reservoir level at Majuro steadily declined during the week, reaching 74% of maximum by the 24th. This is below the 80% threshold of concern, but the monthly total (so far) of 8.38 inches is above the monthly minimum needed to meet most water needs, so D-Nothing continued. Mili was wet this week, and Kwajalein has a September total near the monthly minimum, so D-Nothing continued.
Rain on the last day of the week kept this week from being the fifth consecutive dry week at Pago Pago. Weekly rainfall totals included 2.08 inches at the Pago Pago airport, 2.35 inches at the automated station at Siufaga Ridge, and 1.29 inches at the automated station at Toa Ridge. But September (through the 24th) has been dry (only 3.86 inches of rain at the airport), ranking as the 13th driest September (compared to full Septembers) in 54 years of data and having a historical percentile of 0.24 (which is in the D0 range), so D0-S continued at Tutuila.
Virgin Islands
Wet and dry weather features alternated across the U.S. Virgin Islands (USVI) during this USDM week (9/18/19-9/24/19). The week began with a dry air mass laden with Saharan dust; a tropical wave passed south of the islands across the central Caribbean while Hurricane Jerry passed to the north. Feeder bands generated by Jerry brought areas of rain to the region, but amounts were only a few tenths of an inch. A mid- to upper-level high pressure ridge moved over the area at mid-week, bringing drier air to compete with the outer bands from the departing Jerry. Tropical Storm Karen was approaching the region from the south as the week ended, and Karen's outer rain bands brought rain to the USVI overnight Monday into Tuesday morning, with much more rain to come after the 12z Tuesday USDM cutoff time.
Radar-based estimates of rainfall for the 7 days ending at 12z on Tuesday depicted areas of 0.5 to 2.0 inches of rain across parts of St. Croix and St. Thomas, with 0.5-1.0 inch over St. John.
The Henry Rohlsen AP had almost an inch (0.91) of rain this week, while the Christiansted 1.8 ESE CoCoRaHS station measured 2.49 inches, thanks to rain bands from Tropical Storm Karen, so St. Croix was wet. The monthly total at Rohlsen AP was 1.34 inches, which is below normal, but the monthly total at Christiansted was 5.42 inches. The well level at Adventure 28 has held steady for the last couple weeks, so the rain appears to have stopped its decline. The Standardized Precipitation Index (SPI) values still indicate dry conditions at the 1-, 9- and 12-month time scales, but they were computed before Karen’s rains fell. Based on the radar and CoCoRaHS reports, the D0-L on St. Croix was changed to D-Nothing.
The Cyril E King AP station reported 1.41 inches of rain this week, of which 1.23 inches fell on the 24th which was a record for the date. The total for the month so far was 2.33 inches, which is about half (53%) of normal, and the total for the year of 25.26 inches was about normal (103%). Data for the CoCoRaHS station at Anna’s Retreat went through only September 22nd, and so did not include rains from Tropical Storm Karen. The Grade School-3 Well level continued at relatively high levels, and even showed a slight increase in the last day or two. The SPI values at King AP were neutral to wet at all timescales. As a result of these indicators, D-Nothing continued on St. Thomas.
Data for the unofficial station at Windswept Beach went through September 23rd, so the rains from Karen were not included. Rainfall totals for the week through the 23rd were 0.08 inch and for the month 1.55 inches, which is below the long-term average. SPI values were neutral (not wet and not dry) at all timescales. The USGS Susannaberg DPW 3 Well level showed recovery at the end of August and has been fairly steady since then. As a result, D-Nothing continued on St. John.
Looking Ahead
The overall theme of a persistent and stagnant weather pattern will continue into next week. High pressure will maintain dryness and drought from New England to the Gulf Coast Region, though a series of weak cold fronts may provide chances for much-needed shower activity from eastern portions of Kentucky and Tennessee to the central Atlantic Coast. Likewise, mostly dry weather is expected from the Southwest into the central Rockies and Great Plains. In contrast, wet weather will continue from the Northwest into the northern Plains and upper Midwest, with another ribbon of moderate to heavy rain (locally more than 2 inches) possible from the southern High Plains into the Great lakes Region. The NWS 6- to 10-day outlook for October 1–4 calls for above-normal temperatures across the eastern half of the nation in addition to the southern Plains and western Gulf Coast region, while cooler-than-normal weather prevails from the Pacific Coast into the upper Midwest. Near- to above-normal precipitation across much of the nation will contrast with drier-than-normal conditions across the southeastern quarter of the nation.
Author(s):
Eric Luebehusen, U.S. Department of Agriculture
Richard Heim, NOAA/NCEI
Dryness Categories
D0 Abnormally Dry—used for areas showing dryness but not yet in drought, or for areas recovering from drought.
Drought Intensity Categories
D1 Moderate Drought
D2 Severe Drought
D3 Extreme Drought
D4 Exceptional Drought
Drought or Dryness Types
S Short-Term, typically less than 6 months (e.g. agricultural, grasslands)
L Long-Term, typically greater than 6 months (e.g. hydrologic, ecologic)
Source: National Drought Mitigation Center

