


October 13, 2019 - By Emily Becker - There’s about an 85% chance the tropical Pacific will remain ENSO-neutral through the fall, and a 55-60% chance of continued neutral through the spring. We’ll talk about the current conditions and check in on the Atlantic hurricane season.
A Nightmare on ENSO Street
But wait, you say—Niño3.4 measured 0.5°C above the long-term mean last week! Doesn’t that mean El Niño? While the El Niño threshold is indeed 0.5°C above average, that must persist for several months in a row, and provoke an atmospheric response, to qualify as El Niño conditions. The sea surface temperature in our various ENSO monitoring regions can vary from week to week, affected by weather and subseasonal climate patterns such as the Madden-Julian Oscillation.
The recent bump in sea surface temperature anomalies (anomaly = departure from the long-term average) is likely related to a weakening of the trade winds in mid-September. The trade winds normally blow steadily along the equator from east to west, piling up warm water in the far western Pacific and cooling the surface. When they slow, the surface can warm.
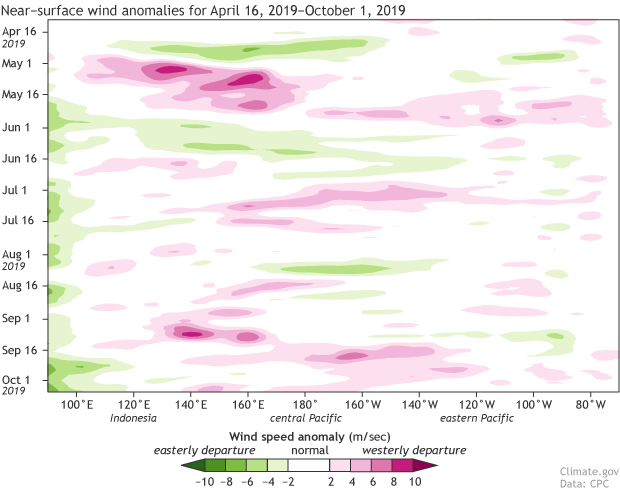
Near-surface wind anomalies over the tropical Pacific (5°N-5°S) during 2019, starting at the top in April and ending in early October 2019 at the bottom. Each row in this type of image is the departure from average (1981-2010) at that time. Pink areas show weaker-than-average trade winds, and green stronger. NOAA Climate.gov image, based on data provided by the Climate Prediction Center.
The slowing of the trade winds also allowed warmer water from the west to begin sliding eastward under the surface, in the form of a downwelling Kelvin wave. As this wave expanded to the east, the overall subsurface temperature anomalyincreased.
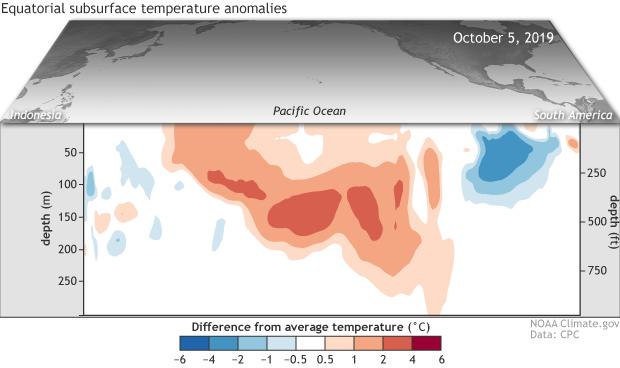
Departure from average of the surface and subsurface tropical Pacific sea temperature averaged over the 5-day period centered on October 5th. The vertical axis is depth below the surface (meters) and the horizontal axis is longitude, from the western to eastern tropical Pacific. This cross-section is right along the equator. Climate.gov figure from CPC data.
Another factor contributing to the increase in subsurface temperature anomaly was a short-term convergence of wind in the eastern Pacific north of the equator. When winds converge on an area, warmer surface ocean water is forced downward, increasing the subsurface temperature.
The ENSO Chainsaw Massacre
As I mentioned above, continued neutral conditions through the winter is the most likely scenario, primarily based on predictions from dynamical and statistical computer models. Many of the models predict a continuation of the current warming through the next month or so as the current downwelling Kelvin wave expands to the east and toward the surface. After that, most of the models show a decrease in Niño3.4 anomalies, but lingering on the warmer side of zero through the winter. This is one reason why probabilities for El Niño are higher than for La Niña, although still substantially lower than for neutral.
Night of the Living ENSO
Without El Niño or La Niña’s relatively predictable impacts, the fall and winter weather and climate will be governed by other processes, as I mentioned at the end of last month’s post. However, transitioning from El Niño to neutral conditions can affect the Atlantic hurricane season. As reflected in NOAA’s updated hurricane season outlook, the lack of El Niño means conditions are more favorable for Atlantic hurricanes.
In short, El Niño’s changes to atmospheric circulation lead to stronger west-to-east winds high above the Atlantic Ocean. These stronger winds contrast with the winds near the surface that generally blow east-to-west, creating vertical shear and making it harder for hurricanes to form and survive. Without El Niño’s effect, vertical shear is reduced, and the atmosphere is more favorable for hurricanes.
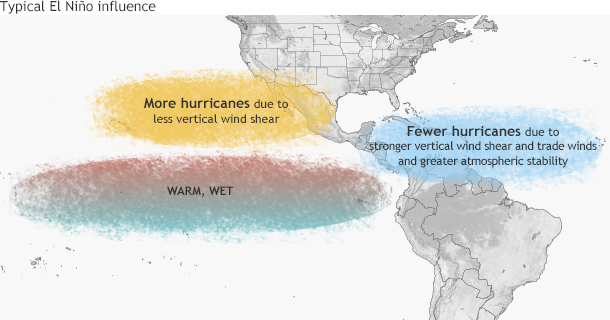
Typical influence of El Niño on Pacific and Atlantic seasonal hurricane activity. As the grip of El Niño weakened in late summer 2019, Atlantic hurricane activity began to pick up. Map by NOAA Climate.gov, based on originals by Gerry Bell.
I checked in with Dr. Phil Klotzbach, a hurricane expert and guest ENSO Blogger, to get some details on the hurricane season so far. The 2019 season did get off to a slow start, with two named storms before August, and ten since then. “Named storms” includes both tropical storms (wind speed between 39 and 73 miles per hour) and hurricanes (winds greater than 74 mph). Dr. Klotzbach mentioned that the accumulated cyclone energy (ACE), a measurement of the hurricane season based on the strength and duration of storms, was running substantially below average through mid-August. That deficit was made up, and then some, by the ten storms since late August, including the powerful storms Dorian and Lorenzo.
Dr. Klotzbach pointed to the change in activity as El Niño ended in August and the atmosphere shifted away from any lingering El Niño-like conditions. This change shows up when you look at the upper-level winds during July and September 2019. While the west-to-east upper-level winds were near average to slightly slower-than-average during July, after El Niño ended they slowed considerably, reducing shear and increasing favorable conditions for hurricanes. This is especially noticeable over the central and eastern Atlantic.
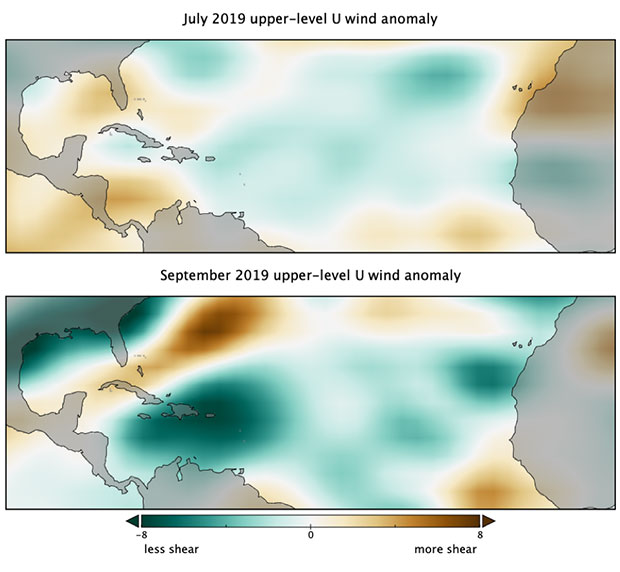
Departure from average in the upper-level zonal wind (west-to-east) during July (top) and September (bottom) 2019. Positive numbers (brown colors) mean the wind is stronger than average, creating more vertical shear. Negative numbers (green colors) mean the wind is weaker than average, with less vertical shear. Data from ESRL/PSD NCEP Reanalysis; figure created using NASA’s Panoply software.
The ENSOcist
Many of you have noticed the recent resurgence of a prominent area of warmer water off the coast of California. We’re not ignoring this—later this month Michelle plans to interview several experts on “The Blob.” Stay tuned!
Thanks to Dr. Caihong Wen (NOAA CPC/Innovim) and Dr. Phil Klotzbach (CSU) for their help with this post!
A blog about monitoring and forecasting El Niño, La Niña, and their impacts.
Disclaimer:
The ENSO blog is written, edited, and moderated by Michelle L’Heureux (NOAA Climate Prediction Center), Emily Becker (University of Miami/CIMAS), Nat Johnson (NOAA Geophysical Fluid Dynamics Laboratory), and Tom DiLiberto and Rebecca Lindsey (contractors to NOAA Climate Program Office), with periodic guest contributors.
Ideas and explanations found in these posts should be attributed to the ENSO blog team, and not to NOAA (the agency) itself. These are blog posts, not official agency communications; if you quote from these posts or from the comments section, you should attribute the quoted material to the blogger or commenter, not to NOAA, CPC, or Climate.gov.
Source: ENSO blog team

