


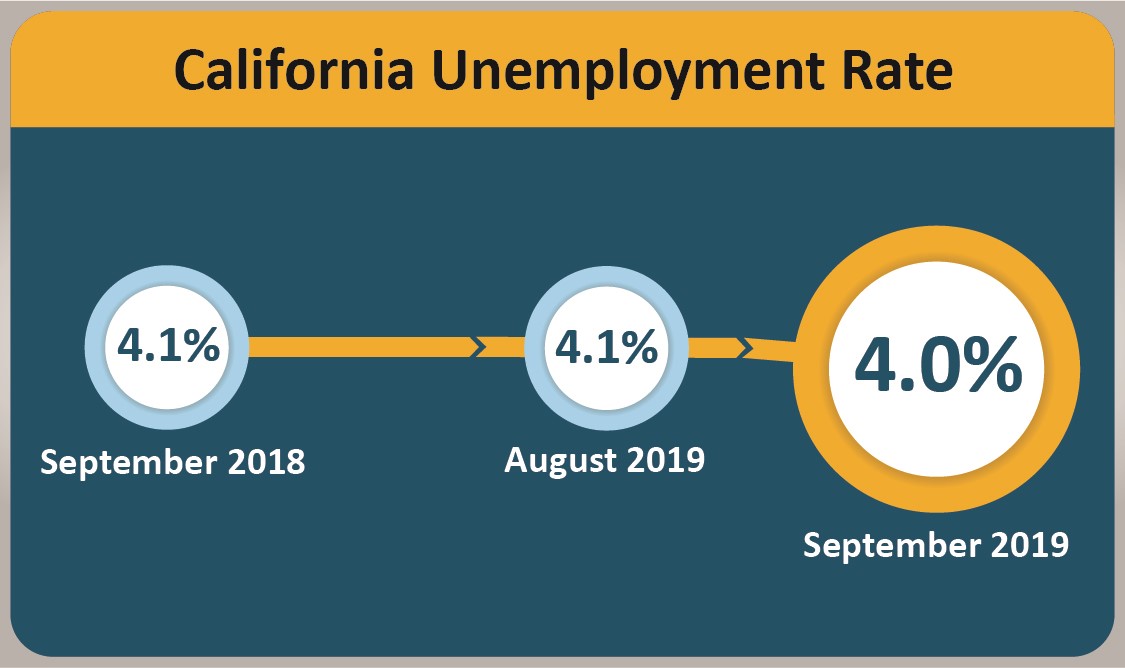
October 18, 2019 - SACRAMENTO – California’s unemployment rate fell to a new record low of 4.0 percent in September while the state’s employers added 21,300 nonfarm payroll jobs, according to data released today by the California Employment Development Department (EDD) from two surveys. The job gains in September contribute to a record job expansion in California of 115 months, surpassing the long expansion of the 1960s. California has gained 3,348,900 jobs since the expansion began in February 2010, accounting for over 15 percent of the nation’s 22 million job gain over the same timeframe.

California’s Labor Market, by the Numbers...
- The state’s unemployment rate fell to 4.0 percent1 in September, setting a new record low in a data series going back to the 1970s.
- California’s record low unemployment rate in September coincided with a 0.2 percent drop in the national unemployment rate to 3.5 percent for the month, a 50-year low.
- September’s 21,300 nonfarm payroll gain extended California’s current job expansion to an all-time record of 115 months. Gains were concentrated in the professional and business services industry, particularly for firms providing employment services, along with increases in the manufacturing and education and health services industry sectors.
- California added an average 29,120 jobs2 per month over the entire 115-month-long expansion — far more than the 8,000-9,000 jobs needed monthly to match labor force growth.
1. The unemployment rate comes from a federal survey of 5,100 California households.
2. The nonfarm payroll job numbers come from a separate federal survey of 80,000 California businesses.
Data Trends about Jobs in the Economy
Total Nonfarm Payroll Jobs (Comes from a monthly survey of approximately 80,000 California businesses that estimates jobs in the economy – seasonally adjusted)
- Month-over – Total nonfarm jobs in California’s 11 major industries totaled 17,538,500 in September – a net gain of 21,300 jobs from August. This followed a revised gain of 32,000 jobs in August.
- Year-over – Total nonfarm jobs increased by 320,000 jobs (a 1.9 percent increase) from September 2018 to September 2019 compared to the U.S. annual gain of 2,147,000 jobs (a 1.4 percent increase).
 EEOmail@edd.ca.gov or call toll free 1-866-490-8879." style="box-sizing: border-box; vertical-align: middle; border-style: none; width: 1100px; max-width: 1100px;">
Total Farm jobs – The number of jobs in the agriculture industry increased by 10,300 jobs from August to 437,500. The agricultural industry has added 12,400 farm jobs since September 2018.
Data Trends about Workers in the Economy
Employment and Unemployment in California (Based on monthly federal survey of 5,100 California households which focuses on workers in the economy)
- Employed – The number of Californians holding jobs in September was 18,626,800, an increase of 38,100 from August and down 39,500 from the employment total in September of last year.
- Unemployed – The number of unemployed Californians was 774,000 in September, a decrease of 17,400 over the month and down by 22,900 compared with September of last year.

Unemployment Insurance Claims (not seasonally adjusted) In related data that figures into the state’s unemployment rate, there were 281,060 people receiving Unemployment Insurance benefits during the survey week in September compared to 309,691 in August and 284,790 people in September 2018. Concurrently, 35,328 people filed new claims in September which was a month-over increase of 553 people.

| COUNTY | LABOR FORCE | EMPLOYMENT | UNEMPLOYMENT | RATE |
|---|---|---|---|---|
|
STATE TOTAL |
19,564,900 |
18,876,300 |
688,600 |
3.5% |
|
ALAMEDA |
860,200 |
838,900 |
21,300 |
2.5% |
|
ALPINE |
480 |
460 |
20 |
4.6% |
|
AMADOR |
15,190 |
14,740 |
450 |
3.0% |
|
BUTTE |
103,900 |
100,100 |
3,800 |
3.7% |
|
CALAVERAS |
21,660 |
21,010 |
640 |
3.0% |
|
COLUSA |
11,050 |
10,310 |
730 |
6.6% |
|
CONTRA COSTA |
571,800 |
557,200 |
14,700 |
2.6% |
|
DEL NORTE |
9,910 |
9,460 |
450 |
4.5% |
|
EL DORADO |
92,300 |
89,700 |
2,600 |
2.8% |
|
FRESNO |
456,000 |
431,700 |
24,300 |
5.3% |
|
GLENN |
13,190 |
12,600 |
580 |
4.4% |
|
HUMBOLDT |
64,200 |
62,400 |
1,800 |
2.7% |
|
IMPERIAL |
72,700 |
57,700 |
15,100 |
20.7% |
|
INYO |
8,860 |
8,630 |
240 |
2.7% |
|
KERN |
392,400 |
368,900 |
23,500 |
6.0% |
|
KINGS |
57,900 |
54,600 |
3,300 |
5.7% |
|
LAKE |
29,950 |
28,850 |
1,100 |
3.7% |
|
LASSEN |
10,010 |
9,690 |
330 |
3.3% |
|
LOS ANGELES |
5,140,600 |
4,911,800 |
228,800 |
4.5% |
|
MADERA |
62,600 |
59,500 |
3,200 |
5.0% |
|
MARIN |
143,100 |
140,400 |
2,700 |
1.9% |
|
MARIPOSA |
8,160 |
7,920 |
240 |
3.0% |
|
MENDOCINO |
39,760 |
38,600 |
1,160 |
2.9% |
|
MERCED |
118,500 |
111,900 |
6,500 |
5.5% |
|
MODOC |
3,220 |
3,070 |
140 |
4.4% |
|
MONO |
8,780 |
8,510 |
260 |
3.0% |
|
MONTEREY |
232,000 |
224,300 |
7,700 |
3.3% |
|
NAPA |
76,100 |
74,400 |
1,600 |
2.2% |
|
NEVADA |
48,730 |
47,440 |
1,290 |
2.6% |
|
ORANGE |
1,631,900 |
1,592,800 |
39,100 |
2.4% |
|
PLACER |
187,200 |
182,300 |
4,900 |
2.6% |
|
PLUMAS |
8,010 |
7,640 |
370 |
4.6% |
|
RIVERSIDE |
1,103,200 |
1,061,400 |
41,800 |
3.8% |
|
SACRAMENTO |
717,000 |
695,000 |
22,000 |
3.1% |
|
SAN BENITO |
31,200 |
30,100 |
1,100 |
3.7% |
|
SAN BERNARDINO |
970,700 |
938,600 |
32,100 |
3.3% |
|
SAN DIEGO |
1,608,100 |
1,564,800 |
43,400 |
2.7% |
|
SAN FRANCISCO |
591,400 |
580,800 |
10,700 |
1.8% |
|
SAN JOAQUIN |
326,700 |
311,500 |
15,200 |
4.7% |
|
SAN LUIS OBISPO |
140,200 |
136,900 |
3,300 |
2.4% |
|
SAN MATEO |
467,300 |
459,300 |
8,000 |
1.7% |
|
SANTA BARBARA |
218,100 |
211,900 |
6,100 |
2.8% |
|
SANTA CLARA |
1,071,800 |
1,049,100 |
22,700 |
2.1% |
|
SANTA CRUZ |
143,300 |
138,800 |
4,500 |
3.1% |
|
SHASTA |
74,200 |
71,500 |
2,600 |
3.5% |
|
SIERRA |
1,410 |
1,360 |
50 |
3.5% |
|
SISKIYOU |
17,740 |
16,980 |
760 |
4.3% |
|
SOLANO |
208,400 |
202,000 |
6,400 |
3.1% |
|
SONOMA |
266,300 |
260,600 |
5,700 |
2.2% |
|
STANISLAUS |
244,800 |
233,400 |
11,300 |
4.6% |
|
SUTTER |
45,800 |
43,500 |
2,200 |
4.9% |
|
TEHAMA |
26,200 |
25,110 |
1,090 |
4.2% |
|
TRINITY |
4,780 |
4,600 |
180 |
3.7% |
|
TULARE |
204,500 |
189,000 |
15,500 |
7.6% |
|
TUOLUMNE |
21,780 |
21,040 |
740 |
3.4% |
|
VENTURA |
421,100 |
407,800 |
13,300 |
3.2% |
|
YOLO |
109,300 |
106,000 |
3,400 |
3.1% |
|
YUBA |
29,300 |
27,900 |
1,400 |
4.8% |
Source:EDD

