


California and National Drought Summary for November 5, 2019
Summary
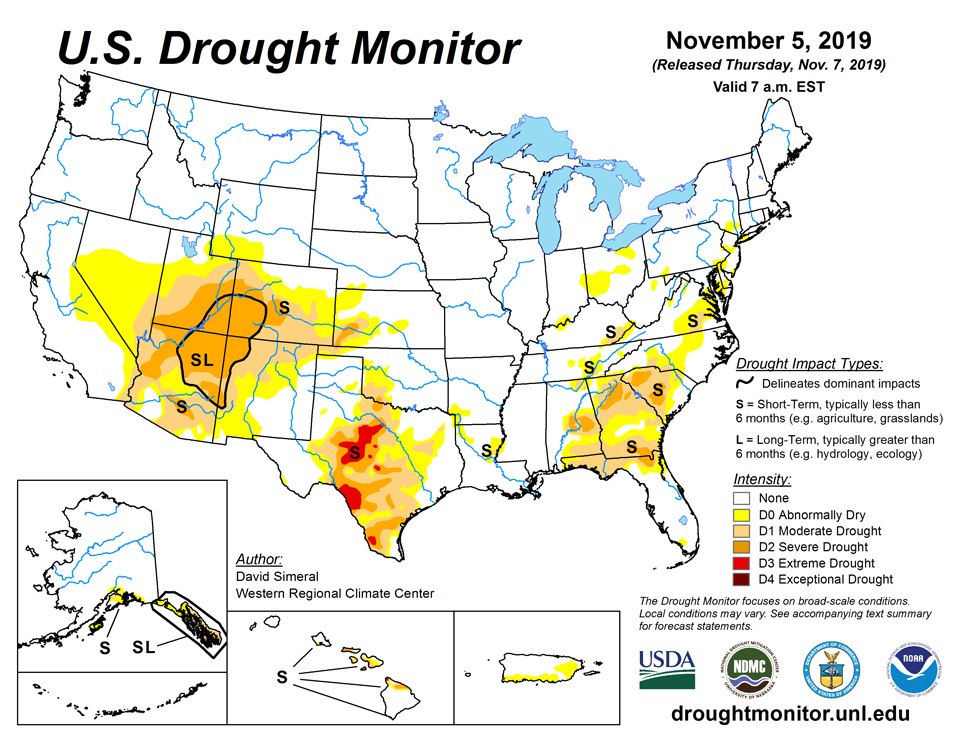
November 7, 2019 - This U.S. Drought Monitor week saw continued improvements in drought conditions as a large-scale, low-pressure system last week delivered moderate-to-heavy precipitation accumulations ranging from 2 to 7 inches leading to widespread improvements across portions of the South, Southeast, Mid-Atlantic, and the lower Midwest. For October, these regions saw well-above-normal precipitation that has helped alleviate drought conditions, especially in the Southeast. Out West, generally dry conditions prevailed with the exception of some mountain snow showers in the central and northern Rockies of Montana, Wyoming, and Colorado. In California, fire-weather conditions improved allowing firefighters in southern and northern California to help contain several large wildfires. According to the NOAA National Centers for Environmental Information (NCEI), the contiguous U.S. experienced its 21st coolest and 8th wettest October on record.
Northeast
On this week’s map, one-category improvements were made in areas of Abnormally Dry (D0) in Maine, Massachusetts, New Hampshire, New York, Maryland, Pennsylvania, and West Virginia in response to several significant precipitation events during the past few weeks. For the past 30-day period, the percentage of normal precipitation has been above normal across the region and 7-day average streamflows have been well above normal. Average temperatures for the week were 2-to-10 degrees above normal across the region with the greatest positive anomalies observed in northern portions of Vermont, New Hampshire, and Maine. According to NOAA NCEI, October ranked as the 20th warmest and 11th wettest on record for the Northeast Climate Region.
Southeast
The region received another round of beneficial rains during the past week with the heaviest precipitation (2-to-4+ inches) observed in northern Alabama and Georgia as well as in western portions of the Carolinas. These recent rains significantly boosted streamflows and soil moisture in parts of the region, although some areas in southern Georgia and northern Florida did not benefit as well and some lingering pockets of dryness remain. In response, widespread one-category improvements were made in areas of Extreme Drought (D3), Severe Drought (D2), Moderate Drought (D1), and Abnormally Dry (D0) across Alabama, Georgia, and South Carolina. Overall, October was very wet with Alabama nearly breaking the statewide record for precipitation (4th wettest). As a region, the Southeast experienced its 11th wettest October on record, according to NOAA NCEI. Across the region, average temperatures were cooler-than-normal across Alabama and Georgia while Florida, the Carolinas, and Virginia were generally above normal, with the largest positive anomalies observed in central and southern Florida (3-to-9 degrees above normal).
South
One this week’s map, recent rainfall across eastern portions of Texas, Arkansas, Louisiana, Mississippi, and Tennessee led to continued widespread improvement in conditions. Rainfall accumulations across the region ranged from 1 to 8 inches with the heaviest accumulations observed in Mississippi. This week’s precipitation improved soil moisture and streamflows leading to one-category improvements in areas of Severe Drought (D2), Moderate Drought (D1), and Abnormally Dry (D0). In portions of southern, central, and western Texas, dry conditions prevailed leading to some minor expansion of drought. As a region, the South experienced its 23rd wettest October on record, while at a state level Mississippi experienced its wettest October on record. For the week, average temperatures were below normal across the entire region with the greatest negative anomalies observed across the northern half of Texas and western Oklahoma where temperatures were 10-to-20 degrees below normal. As a region, the South Climate Region had its 36th coolest on record for October.
Midwest
On this week’s map, one-category improvements were made across portions of Illinois, Indiana, Ohio, and Kentucky in response to another round of rainfall this week that helped boost soil moisture and streamflow levels as well as erase some of the longer-term (60–90 day) precipitation deficits. For October, the Ohio Valley Climate Region experienced its 6th wettest on record while the Upper Midwest Climate Region experienced its 3rd wettest October on record. For temperature, the Ohio Valley Climate Region had its 41st warmest (top 1/3) October while, in contrast, the Upper Midwest experienced its 33rd coolest (bottom 1/3). In terms of snowpack, the NWS National Operational Hydrologic Remote Sensing Center (NOHRSC) is reporting that the Northern Great Lakes Region currently has snow covering 22% of the region. For the week, average temperatures were mainly near normal to slightly above normal across much of Indiana, Kentucky, and Ohio, while further west in the region temperatures were 4-to-8 degrees below normal.
High Plains
On this week’s map, no changes were made across the region. For the week, the entire region was relatively dry with below-normal temperatures. Average temperatures ranged from 2-to-20 degrees below normal with the greatest negative anomalies observed in north-central and eastern Wyoming as well as eastern Colorado. According to NOAA NCEI, the Northern Rockies and Plains Climate Region experienced its 4th coolest and 26th wettest October on record. Additionally, the region had its wettest 3-month (Aug-Oct 2019), 9-month (Feb-Oct 2019), and 12-month (Nov 2018-Oct-2019) periods on record.
West
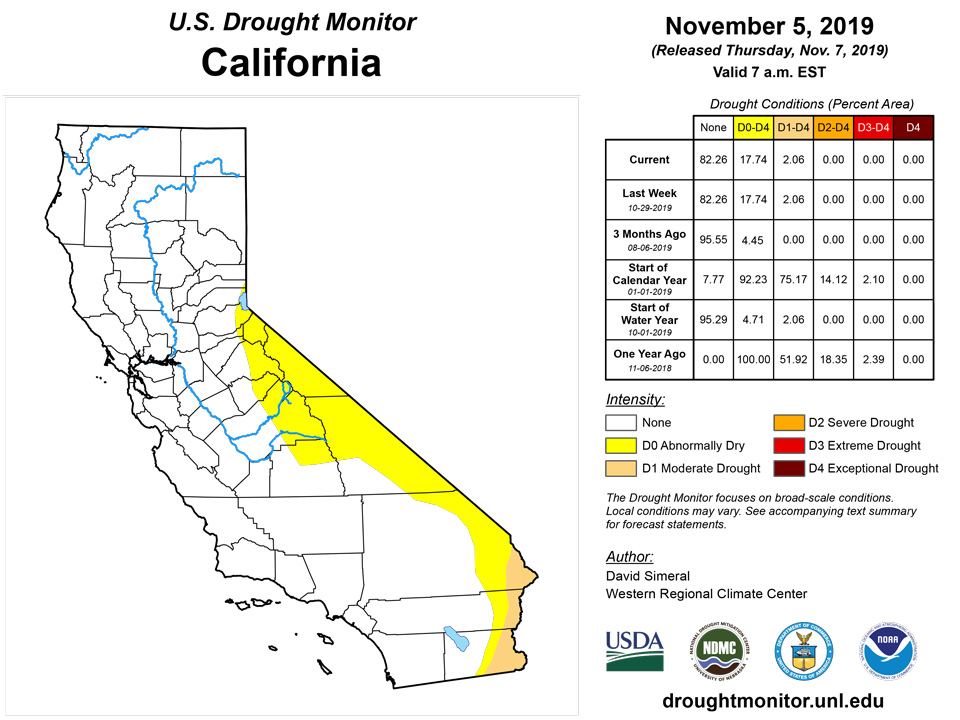
On this week’s map, no changes were made in the region. An on-going assessment of the abnormally dry conditions in California (since the beginning of the wet season) is currently underway by the U.S. Drought Monitor and the California Drought Coordination Team in order to ascertain the spatial extent and possible impacts being observed across the state. From a hydrologic perspective, despite below-normal precipitation during the past 60 days, nearly all of California’s major reservoirs are currently at or above historical averages for this time of year. Elsewhere in the region, portions of the central and northern Rockies received some snow shower activity during this past week. According the NWS NOHRSC’s regional snow analyses, 68.8% of the Northern Rockies and 59.7% of the Central Rockies are currently covered by snow. Additionally, the NRCS SNOTEL network is showing above-normal Water Year to Date (Since Oct 1) precipitation (liquid and frozen) in the mountains of northeastern Oregon, central Idaho, western Montana, northern Wyoming, and north-central Colorado. Elsewhere, stations are reporting below-normal precipitation for the same period. According to NOAA NCEI, the West Climate Region experienced its 11th driest and 19th coolest October on record while the Northwest Climate Region had its 49th driest and 2nd coolest October.
Alaska, Hawaii, and Puerto Rico
Only minor changes were made on this week’s map in the Hawaiian Islands. On the Big Island, some improvements were made in response to recent rainfall and improvements in pasture conditions on the southern part of the island at South Point. Meanwhile, poor pasture conditions remain along the upper leeward slopes of the Kohala District. Across the island chain, average temperatures for the week were within a degree or two of normal, with the exception of the windward coast of Big Island that was 3-to-5 degrees above normal. For October 2019, the Hilo Airport experienced its hottest October on record (dating back to 1949), with an average temperature of 79.6° F. Likewise, on Molokai, the airport had its hottest October on record with an average temperature of 81.2° F, the 3rd month in a row that the airport broke the maximum monthly average temperature record. During the past week, dry conditions prevailed across the islands except for some light-to-moderate shower activity (1-to-2.5 inches) on the windward side of Big Island as well as light shower activity in the windward coasts of Maui, Oahu, and Kauai. In Southeast Alaska, an area of Severe Drought (D2) was removed as autumn rains helped to improve reservoir conditions in the Ketchikan area where precipitation was slightly above normal for the month. In other locations in Southeast Alaska, precipitation was generally below normal for the month. This week, Prince William Sound and portions of Southeast Alaska, saw precipitation accumulations (liquid) ranging from 3-to-5 inches while the rest of the state was generally dry. Average temperatures for the week were above normal across much of Alaska with parts of the Interior, North Slope, and western Alaska experiencing large positive temperature anomalies—ranging from 10-to-20 degrees above normal. The observing station at Barrow Airport in Utqiagvik, Alaska experienced its warmest October on record (dating back to 1901) with an average temperature of 48.3° F. For Puerto Rico, no changes were made on this week’s map. On the island, moderate-to-heavy precipitation was observed in western portions of the Cordillera Central with accumulations ranging from 2-to-6 inches.
Pacific Islands
9.51 inches of rain fell during the month of October at Pago Pago, and drought-free conditions continued there.
13.94 inches of rain fell at Palau during October, so drought-free conditions continued there.
Drought-free conditions continued in the Mariana Islands this week. On Saipan, October rainfall totaled 12.93 inches, keeping overall conditions wet there. However, the most recent two weeks’ rainfall have only totaled 0.51 inches and 0.11 inches. 9.17 inches of rain in October and over an inch of rain in the last week continued drought-free conditions on Rota. Guam received 10.53 inches of rain in October, and 1.61 inches in the last week.
In October, Yap received 8 inches of rain, keeping abnormal dryness at bay. However, the last few weeks have seen below two inches of rain, so some short-term dryness is taking place here. Ulithi and Fananu do not have a depiction for this week, due to missing data. Short-term abnormal dryness continues on Woleai, though catchments were filled recently by increased rainfall. Recent short-term dryness at Chuuk (5.54 inches of rain for October and less than an inch of rain the last two weeks) have placed Chuuk near abnormally dry levels. Lukunor continued to experience abnormal dryness, where September and October rainfall totaled 6.44 and 5.79 inches, respectively. Drought-free conditions continued on Nukuoro, where October rainfall reached 10.44 inches. Drought-free conditions also continued on Kapingamarangi, where 10.22 inches of rain fell in October. 19.74 and 21.0 inches of rain also fell in Pohnpei in September and October, so drought-free conditions continued there. The last two weeks of October in Pingelap fell short of 2 inches of rainfall, and October rainfall totals reached 7.40 inches, so some short-term dryness is taking place (though not yet at abnormally dry levels). September and October rainfall on Kosrae reached 9.78 and 10.74 inches, respectively, so drought-free conditions continued there.
Rainfall in Kwajalein in September and October reached 9.89 and 10.53 inches, so conditions remained free of drought there. At Ailinglapalap, while some recent weeks have received insufficient rainfall, October total rain reached 8.17 inches, and this week’s rainfall totaled 5.54 inches, so drought-free conditions continued there. Last week, Jaluit received 3.19 inches of rainfall, but only 0.33 inches fell in the last week of October. Going back to April 2019, every month has received less than 8 inches of rainfall, and July and October received less than four inches, so severe short- and long-term drought continues there. While two weeks in the middle of October fell below one inch of rain on Utirik, the last two weeks have exceeded two inches, so abnormally dry conditions have ended there. In the last week, 5.84 inches of rain fell on Wotje, after no rain fell in the previous week. Given that August-October rainfall totals all exceeded 8 inches and the large amount of rain this week, abnormally dry conditions have ended on Wotje. On Majuro, August-October rainfall totals reached 12.69, 11.73, and 15.12 inches, respectively, so drought-free conditions continued there. October rainfall on Mili was 19.33 inches, so drought-free conditions are taking place there.
Virgin Islands
Drier short-term conditions have been noted on St. John and St. Thomas, though neither is at the level of abnormally dry conditions yet. Moderate drought continued this week at St. Croix; the designation was changed to SL to reflect that precipitation deficits now also exist at time scales greater than 6 months there.
Looking Ahead
The NWS WPC 7-Day Quantitative Precipitation Forecast (QPF) calls for moderate-to-heavy accumulations ranging from 1 to 4 inches across a swath extending from northern Texas to Kentucky later this week. Further south, light-to-moderate accumulations (1-to-2 inches) are expected along the Gulf Coast and in south Texas. Along the Great Lakes and the Northeast, periods of precipitation (accumulations generally <1 inch liquid), including some heavy lake-effect snowfall, are expected. Out West, primarily warm and dry conditions will prevail with the exception of northern portions of the Pacific Northwest and northern Rockies that may see periods of mountain snow. The CPC 6–10-day Outlook calls for a high probability of above-normal temperatures west of the Rockies while areas east of the Rockies are expected to be below normal. In terms of precipitation, there is a moderate-to-high probability of below-normal levels across most of the West including the Intermountain West, Great Basin, California, and the Pacific Northwest while there is a moderate probability of above-normal precipitation in eastern Montana and western portions of the northern Plains. Likewise, above-normal precipitation (moderate probability) is expected in the southern tier from Texas to Florida and extending up the Eastern Seaboard.
Author(s):
David Simeral, Western Regional Climate Center
Curtis Riganti, National Drought Mitigation Center
Dryness Categories
D0 Abnormally Dry—used for areas showing dryness but not yet in drought, or for areas recovering from drought.
Drought Intensity Categories
D1 Moderate Drought
D2 Severe Drought
D3 Extreme Drought
D4 Exceptional Drought
Drought or Dryness Types
S Short-Term, typically less than 6 months (e.g. agricultural, grasslands)
L Long-Term, typically greater than 6 months (e.g. hydrologic, ecologic)
Source: National Drought Mitigation Center

