


California and National Drought Summary for December 10, 2019
Summary
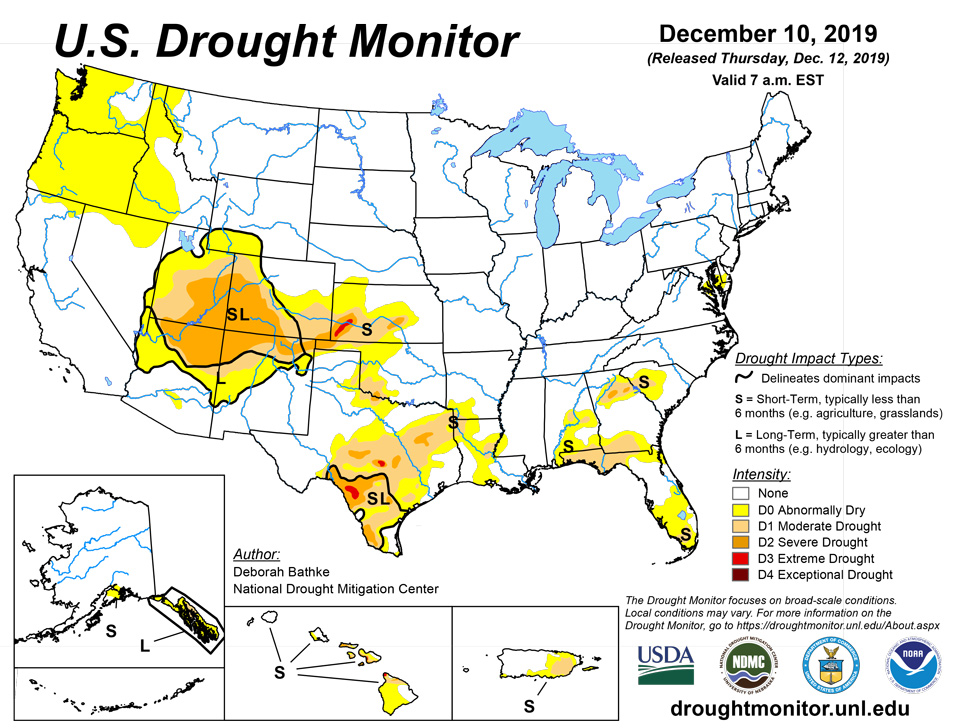
December 12, 2019 - The U.S. Drought Monitor week saw another round of winter storms, bringing snow to the mountainous areas of the West, northern Plains, upper Midwest, and Northeast while lower elevations of the West and parts of the South, Southeast, lower Midwest, and Mid-Atlantic regions saw rain. This week’s precipitation in the Southwest left many areas with accumulations that exceeded 300 percent of normal over the past 14-day period, leading to continued improvements in short-term dryness. Once again, precipitation in the Northwest was below normal. Many locations have received less than 25 percent of normal over the last 14 days, resulting in the expansion of abnormally dry conditions. Meanwhile, another dry week in the Southern Plains and below-normal rainfall in the South and Southeast led to expansions in pockets of abnormal dryness and drought.
Northeast
This week’s rainfall helped alleviate the impacts of a dry autumn in the Northeast. Lingering abnormal dryness (D0) was removed from New Jersey. An area of D0 remains over the Delmarva Peninsula where rainfall deficits, low streamflow, dry soils, and reduced groundwater remain.
Southeast
Rainfall in the Southeast was predominantly below normal last week. While deficits continue to build, they were not enough to warrant degradations in most areas. Exceptions were minor expansions in abnormal dryness (D0) in eastern Alabama and Florida where streamflow has declined and vegetation shows stress.
South
The South once again saw a mixture of degradations and improvements. Improvements were limited to central Texas, where last week’s rainfall, in excess of 300 percent of normal, resulted in a general one-category improvement. Meanwhile, the eastern and southern parts of the state continued to dry out with expansions to areas of abnormal dryness (D0) and moderate (D1) and severe (D2) drought. The heavy black line separating drought impact designations was shifted eastward in south Texas to reflect that this area is also experiencing dryness at longer (more than 6 months) time scales. Eastern Oklahoma also saw degradations with an expansion of D0 as dryness, extending back to September, continued. This dryness comes at a vital time in winter crop cycles, and a continued lack of moisture may cause impacts later. Other degradations include the expansion of D0 and/or D1 in southwest Arkansas, Louisiana, and southwest Mississippi.
Midwest
The Midwest remains free of abnormal dryness and drought.
High Plains
Last week’s weather brought continued dryness to the abnormally dry and drought areas of south-central Nebraska, Kansas and eastern Colorado. In Kansas, where moisture deficits have been present for more than three months, abnormal dryness (D0), moderate drought (D1), and severe drought (D2) were expanded to reflect the increasing dryness and its impact on winter wheat. The map was unchanged this week for the remainder of the region.
West
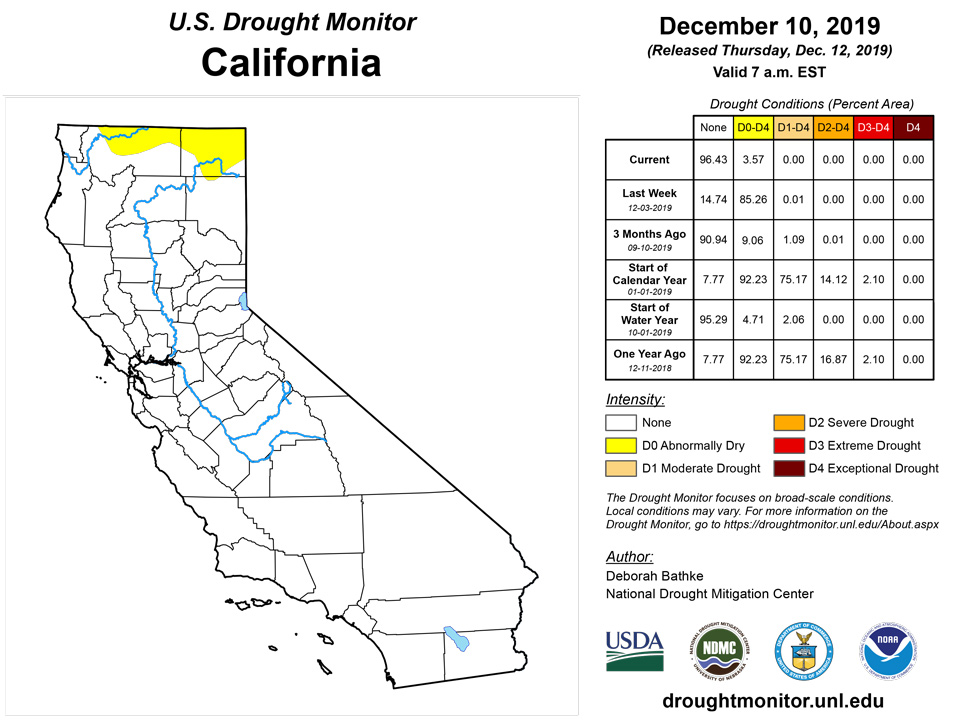
Another week of above-normal rainfall and mountain snow led to continued improvements in the Southwest. In California and Nevada, rainfall over the last three weeks has helped to make up for the slow start to the water year, resulting in the removal of the abnormal dryness (D0) depiction across most of the state. Pockets of D0 remain in areas that missed the heaviest precipitation or where station data indicate below-normal snow. In the Four Corners states, the map depiction strives to balance the effect of the recent precipitation with the failure of the monsoon. Changes include a broad 1-category improvement across southern and western Arizona, western Utah, and western New Mexico. The heavy black line separating drought impact designations was expanded to delineate areas that are experiencing both short- (less than 6 months) and long-term (greater than 6 months) deficits. For example, the designation across southern and western Arizona is “L”, indicating that deficits are only present at longer time scales and in indicators such groundwater and root zone soil moisture, whereas the designation in eastern Colorado is “S”, indicating more seasonal deficits and impacts to indicators such as surface soil moisture and streamflow.
Alaska, Hawaii, and Puerto Rico
In Alaska, precipitation was below normal for the week over the long-term drought areas of the southeast where year-to-date deficits in excess of 20 inches remain. While precipitation was above normal for the Kenai Peninsula, longer deficits are still present and snow remains below normal.
In Puerto Rico, no changes were made given the degradations that were introduced last week. Note that deficits continue to build in the eastern part of the island, where deficits of about 4 to 13 inches have occurred over the last 90 days.
In Hawaii, rainfall helped improve conditions on Kauai and the northwest coastal slopes of Molokai. Rainfall in the eastern part of the state was not enough to warrant improvements, and vegetation conditions continue to decline. This week’s map saw the following degradations: an expansion of moderate drought (D1) on Lanai; an expansion of extreme drought (D3) and the introduction of exceptional drought (D4) on Maui; and an expansion of moderate drought (D1) and severe drought (D2) on the Big Island.
Pacific Islands
The weather pattern across Micronesia during this USDM week (12/04/19-12/10/19) consisted of a monsoon trough which developed across Palau and the Federated States of Micronesia (FSM), stretching into the southern Marshall Islands (RMI) at one point. The monsoon trough migrated southward as the week progressed, ending the week mostly across just southern Palau. Weak tropical disturbances moved within the trough during the week. Surface troughs and low-level convergence were associated with some of the disturbances. An upper-level low and its associated trough over the northern RMI moved westward north of the FSM as the week progressed. South of the equator, the week began with a surface trough/area of low-level convergence northeast of the Samoan Islands and high pressure to the south; the trough migrated over American Samoa as the week progressed.
Satellite-based estimates of 7-day precipitation (QPE) showed areas of 2+ inches of rain stretching from northwestern Yap State southeastward across the equator to east of the Samoan Islands. In the Micronesia region, the 2+ inch areas occurred northwest to southeast across Yap to Chuuk States, then southwest to northeast across southern Pohnpei State to the eastern RMI. In general, less than an inch of rain was indicated outside these areas. South of the equator, the 2+ inch areas were mostly north to east of the Samoan Islands, although spotty tendrils of 2+ inches touched American Samoa.
Drought-free conditions persisted this week at Palau as they had 3.81 inches of rain this drought week.
Rainfall totals for the week were less than half an inch across the Mariana Islands. Guam had only 0.23 inch, Rota 0.34 inch, and Saipan’s ASOS station had 0.28 inch (ASOS) and 0.29 inch at the NPS station. Although precipitation totals were less than the weekly 1-inch threshold to meet most water needs, drought-free conditions remain as the previous weeks and months were wet.
This was a dry week for the Federated States of Micronesia, with most stations receiving less than their 2-inches weekly threshold to meet most water needs. The stations in Yap, Pohnpei, Kosrae, and Nukuoro had the least rainfall, receiving less than 1 inch of rain; however, drought free conditions remain for these stations since this was the first week of dry conditions after very wet conditions the previous weeks. Kapingamarangi had 1.40 inches of rain this week and remained in drought free status since it has been extremely wet the last few weeks. Lukunoch and Woleai had less than 2-inch of rain this week. Since monthly precipitation totals since September 2019 have been less than the monthly threshold of 8 inches to meet most water needs, abnormally dry conditions persisted in Lukunoch and Woleai. Chuuk Lagoon was the only station that had a wet week, with 2.82 inches of rain. Drought free conditions persisted in Chuuk Lagoon.
Rainfall varied across the Marshall Islands this week. Majuro and Mili had the highest rainfall totals at 7.05 and 6.52 inches of rain, which is more than triple the weekly threshold minimum of 2 inches to meet most water needs. Jaluit was the other station that had more than 2-inches of rain. Ailinglapalap and Kwajalein had less than 2-inches of rain at 1.45 and 1.44 inches, respectively. Utirik and Wotje were the only stations that had less than half an inch of rain during the week. However, since this was the first or second week with low precipitation totals for these two locations, drought-free conditions were unchanged.
With 3.13 inches of rain for the week, drought free conditions continue in Tuituilla this week.
Virgin Islands
The Cyril E. King Airport had only 0.33 inch of rain during this drought week (December 4-10, 2019). The airport’s month-to-date precipitation of 0.82 inch is 77.4% of normal rainfall. The CoCoRaHS station at Anna’s Retreat 2.5 ESE had slightly higher rainfall totals at 0.64 inch of rain for the week and 0.83 inch for the month-to-date. The Cyril E. King Airport's year-to-date rainfall was 33.02 inches or 88.2% of normal rainfall. SPI values for 1 and 3 months were -0.83 and -0.98, typically representing moderate drought, while SPI values for 6, 9, and 12 months indicated no drought development. St. Thomas drought classification was changed to short-term abnormally dry conditions (D0-S).
According to data from the Henry E. Rohlsen airport, only 0.11 inch of rain fell during this drought week. The month-to-date rainfall was 0.61 inch or 54.5% of normal rainfall. However, the CoCoRaHS station at Christiansted 1.8 ESE reported for the week 1.02 inches of rain and 1.47 inches for the month-to-date. The year-to-date rainfall total at the airport is 22.72 inches or 61.7% of normal rainfall. Meanwhile, the East Hill COOP station had 26.28 inches of rain for the year-to-date, which is 75% of normal rain. SPI values at 1, 6, and 9 months indicate moderate drought, while 3 and 12 months indicate extreme and severe drought, respectively. For this week, St. Croix's drought classification remained as in moderate drought (D1-SL).
According to data provided by a volunteer observer, St. John had only 0.06 inch of rain during this drought week. The month-to-date rainfall total (as of December 9, 2019) was 0.75 inch. The year-to-date value of 34.71 inches of rain is 78.0% of normal. SPI values for 1 and 3 months were -1.12 and -1.34, respectively, typically representing moderate to severe drought conditions. While the 9 and 12 months indicate abnormally dry to moderate drought conditions. St. John’s drought designation was changed to moderate drought this week.
Looking Ahead
The National Weather Service Weather Prediction Center forecast for the remainder of the week calls for moderate to heavy mountain snows extending from the Pacific Northwest to the north-central Great Basin and Rockies. Meanwhile, parts of the northern High Plains, Upper Mississippi Valley, and upper Great Lakes are expected to see snow. As this storm moves eastward over the weekend, the Southeast, Tennessee Valley, and Mid-Atlantic will see rain, while mixed precipitation is expected in the Northeast. Dry conditions are expected in the Southwest, Southern Plains, and lower Mississippi River Basin.
Moving into next week, the Climate Prediction Center 6 to 10 day outlook (valid December 16-20) favors above-normal temperatures for the central and northern coast of California; parts of the Pacific Northwest, Southwest, and Central Plains regions; and the Florida Peninsula. Areas with increased chances for below-normal temperatures include parts of the Ohio and Tennessee Valleys and the Northeast region. Precipitation is likely to be above normal over the Pacific Northwest, parts of northern California, and from the Southern Plains, across the Southeast, and into the Mid-Atlantic region.
Author(s):
Deborah Bathke, National Drought Mitigation Center
Ahira Sanchez-Lugo, NOAA/NCEI
Dryness Categories
D0 Abnormally Dry—used for areas showing dryness but not yet in drought, or for areas recovering from drought.
Drought Intensity Categories
D1 Moderate Drought
D2 Severe Drought
D3 Extreme Drought
D4 Exceptional Drought
Drought or Dryness Types
S Short-Term, typically less than 6 months (e.g. agricultural, grasslands)
L Long-Term, typically greater than 6 months (e.g. hydrologic, ecologic)
Source: National Drought Mitigation Center

