


California and National Drought Summary for December 31, 2019
Summary
January 2, 2020 - An area of upper-level low pressure entered southern California by December 26 and then progressed east across the Four Corners region. This upper-level low resulted in heavy rain and high-elevation snow from southern California east to southwest Colorado and New Mexico. A surface low developed across the south-central Great Plains on December 28 with a subsequent track northeast to the upper Mississippi Valley and Great Lakes. Heavy snow fell to the northwest of this low pressure system, while moderate to heavy rainfall accompanied the cold front as it shifted east from the Great Plains to the East Coast. Following the heavy precipitation across the Pacific Northwest during mid to late December, precipitation average below normal during the final week of December. Enhanced onshore flow resulted in periods of heavy precipitation along the Alaska Panhandle, but longer-term precipitation deficits persist. A low pressure system and trailing front brought locally heavy rain and damaging winds to parts of the Hawaiian Islands this past week.
Northeast
Precipitation (0.5 to 2 inches) overspread this region on December 29 and 30. Heavy snow (6 to 12 inches) was reported in northern New England, while freezing rain accumulated up to one inch in extreme northern New York. A small area of abnormal dryness (DO) remains designated for parts of southern Delaware and the eastern shore of Maryland based on: 6-month deficits of 4 to 8 inches and 7-, 14-, and 28-day stream flows in the 10-24th percentile. Elsewhere, precipitation averaged at or above normal for the 30- to 90-day period.
Southeast
Following a very wet week which eliminated much of the lingering drought across the Southeast, drier weather returned to the region. The abnormal dryness (D0) area in northeast North Carolina was extended slightly more north in southeast Virginia. Otherwise, no other changes were needed after the major revision during the previous week. Based on 90-day percent of normal precipitation, moderate drought (D1) and abnormal dryness (D0) continues from the Florida Big Bend north to southwest Georgia. The current depiction of D0 and D1 across the Florida Peninsula is based on 90-day precipitation deficits along with 28-day stream flows.
South
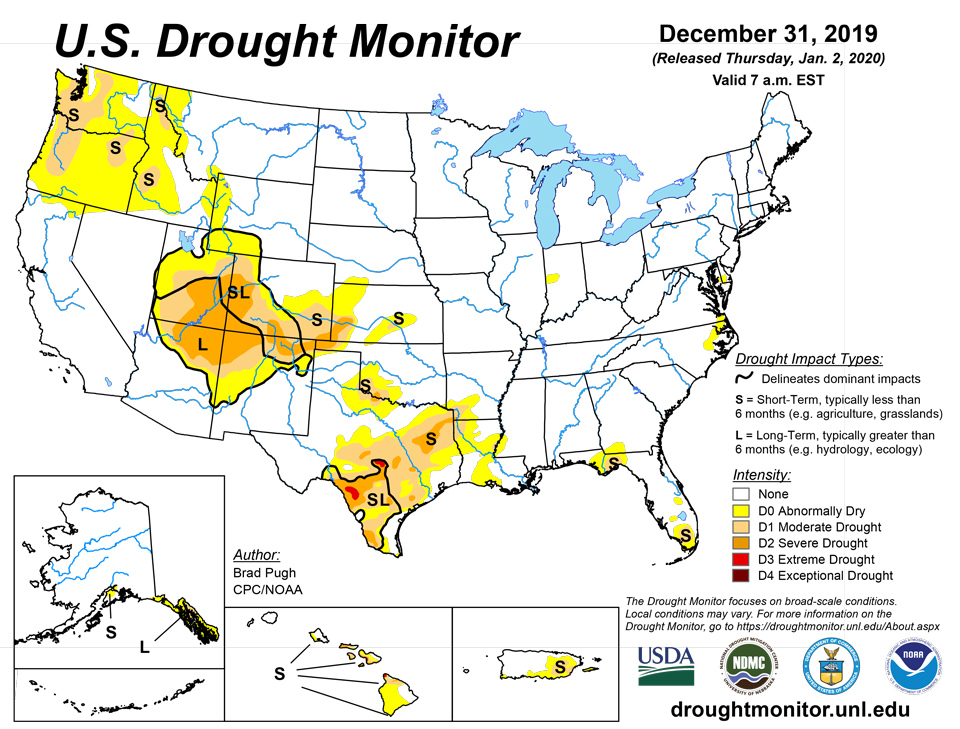
As an upper-level trough ejected from the desert Southwest, a surface low developed over the southern Great Plains. Beneficial rainfall (more than 1 inch) resulted in improving conditions across the eastern Oklahoma Panhandle and northwest Oklahoma. Moderate (D1) to severe (D2) drought continues across southwest Oklahoma and adjacent areas of the Texas Panhandle and northwest Texas which received lighter rainfall amounts (0.75 inches of less). Changes to the drought depiction across the remainder of Texas included a slight reduction in D0/D1 in central and southwest parts of the state, based on recent rainfall and lack of short-term dryness. Although it was a dry week across deep southern Texas, a reassessment of indicators supported a slight reduction of severe (D2) drought. A small area of severe (D2) drought was added to Burleson County, based on 120-day indicators. On December 29, a cold front crossed the lower Mississippi Valley where 0.5 to 2 inches of rainfall occurred. The heaviest rain fell to the north and east of the ongoing D0 to D2 areas.
Midwest
A low pressure system and trailing cold front brought widespread rain and snow to this region on December 29 and 30. Abnormal dryness (D0) was added the previous week to parts of central Indiana based on 90-day precipitation deficits of 2 to 4 inches and 28-day stream flows below the 30th percentile. This D0 area was decreased slightly where more than 0.5 inch fell. Elsewhere, 90-day precipitation averages 150 to 200, or more, percent of normal across Kentucky, Michigan, Wisconsin, Minnesota, and the northwest two-thirds of Iowa.
High Plains
A low pressure system developed across the southern Great Plains on Dec 28 and then tracked northeast to Iowa and Minnesota. Along and northwest of the surface low track, beneficial precipitation (0.5 to 1.5 inches) fell from the western half of Kansas north to southern and eastern Nebraska. This recent precipitation prompted a 1 to 2-category improvements to the short-term drought areas in Kansas. A 2-category improvement was justified where more than 1 inch of precipitation occurred and 90-day precipitation is either at or above normal. However, severe drought (D2) continues west of Garden City and Liberal, Kansas. In contrast to the improving conditions for Kansas, abnormal dryness (D0) was extended north across western Wyoming where 90-day precipitation deficits are 2 to 6 inches. Drought impacts were modified to long-term only in southwest Colorado due to recent snowfall. Snow water content is running 125 to 135 percent of normal as of December 29, but 6-month SPI values support the severe drought (D2) category in southwest Colorado.
West
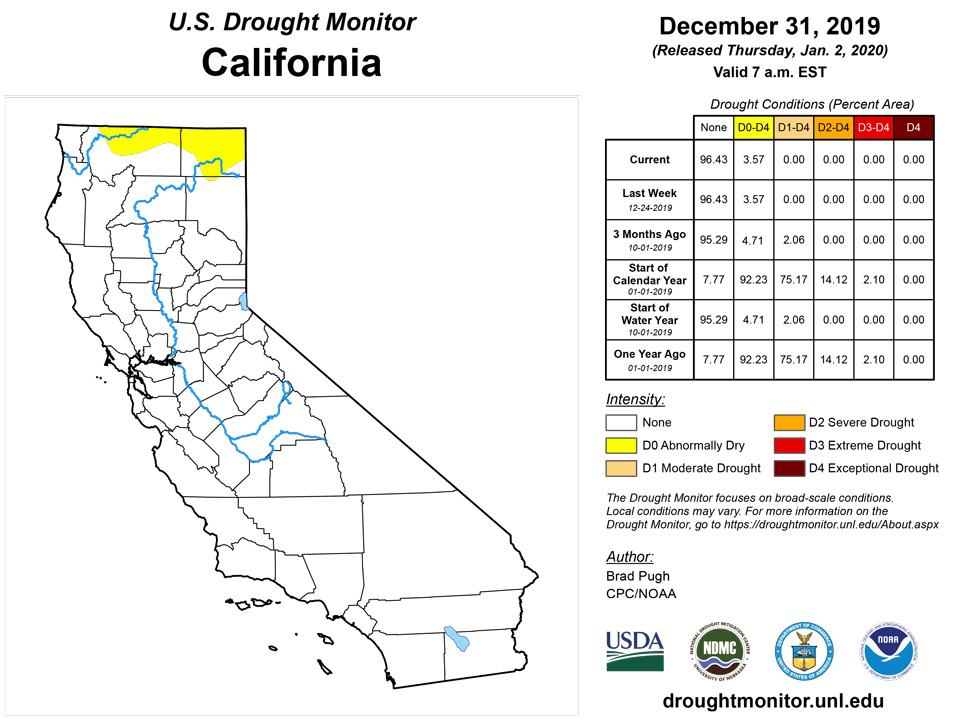
A vigorous upper-level trough crossed southern California and the desert Southwest from December 25 to 27. Widespread moderate to heavy rain and high-elevation snow (0.5 to 2 inches, liquid equivalent) accompanied this upper-level trough. Snowfall amounts exceeded two feet in the mountains of southern California, while 4 to 12 inches was recorded in the higher elevations of Arizona. This recent precipitation along with support from longer-term SPI values resulted in a 1-category improvement to Dx levels in parts of Arizona and southwest Utah. 180-day precipitation deficits remain the largest (more than 6 inches) across southwest Colorado.
Drier weather returned to the Pacific Northwest during the final week of December. Following the period of heavy precipitation during mid to late December, no changes were made to the ongoing abnormal dryness (D0) and short-term moderate drought (D1) areas. Water year to date (since October 1) precipitation deficits of more than 12 inches, 28-day stream flows in the lowest 10th percentile, and basin average snow water content less than 50 percent support the short-term moderate drought (D1) across parts of Oregon and Washington.
Alaska, Hawaii, and Puerto Rico
Multiple low pressure systems with onshore flow resulted in frequent daily precipitation along the Alaska Panhandle. Despite the good start to the water year, long-term deficits persist with consecutive poor water years in 2017-18 and 2018-19. Therefore, no changes were made to the ongoing long-term D0 and D1 areas in Alaska.
A low pressure system tracked west of Hawaii during late December. The trailing front, associated with this low pressure system, resulted in locally heavy rainfall (especially in Kauai). However, much of the rainfall occurred outside of ongoing drought areas. Any changes will be made in subsequent weeks after a more thorough analysis of rainfall observations and NDVI.
During the past week, locally more than 2 inches of rainfall occurred in southern Puerto Rico. However, an inch or less of rainfall was observed across the ongoing moderate (D1) drought area in eastern Puerto Rico. Coinciding with this D1 area, 28-day stream flows are generally near or below the 20th percentile and 90-day precipitation deficits exceed 8 inches.
Pacific Islands
During the Northern Hemisphere winter, the North Pacific subtropical high, and the low latitude Inter-Tropical Convergence Zone (ITCZ), migrate south toward the equator. The seasonal migration brings drier subtropical trade winds to the northern portions of Micronesia and ITCZ rainfall to the southern regions. The weather conditions across the U.S.-Affiliated Pacific Islands (USAPI) during this USDM week (12/25/19-12/31/19) consisted of a near-equatorial trough (ITCZ) across the Federated States of Micronesia (FSM) and Marshall Islands (RMI), with a shear line and cold front accompanying the dry trades over the Marianas. A broad but weak circulation developed in the trough over the RMI and moved across eastern and central FSM, with its surface convergence aided by upper-level divergence later in the week. Trade-wind convergence brought showers to parts of the RMI and Palau. South of the equator, the South Pacific Convergence Zone (SPCZ) stretched from near Micronesia southeastward toward and beyond the Samoan Islands. Circulations formed within the SPCZ trough, including one which developed into Tropical Cyclone Sarai (04P) west of American Samoa.
Satellite-based estimates of 7-day precipitation (QPE) showed a band of 2 to 4+ inches of rainfall across parts of Yap and Chuuk States, with little to no rain north and south of this band. An area of 1-4 inches extended across the eastern FSM into parts of the RMI, with lesser amounts north and south. The satellite QPE showed a large area of 4+ inches stretching south of the equator from Micronesia to near, west, and south of the Samoan Islands, with 2-4 inches indicated across American Samoa.
In the Republic of Palau, four-fifths of an inch (0.86 inch) of rain fell at the Palau International Airport. But with previous weeks wet and the monthly total at 9.86 inches (which is above the 8-inch monthly minimum needed to meet most water needs), D-Nothing continued at Palau.
In the Marianas, the last 3 or 4 weeks have been dry (below the 1-inch weekly minimum) for Guam and Rota and (depending on the observation site) Saipan. Guam had a monthly total of 1.46 inches, which is drier than the previous driest December (2.17 inches in 1992). Less than two tenths of an inch of rain was recorded this week at Guam (0.06) and Rota (0.13), and a third of an inch at Saipan (0.34). D-Nothing continued this week because local NWS personnel reported vegetation is still very green for Guam and Rota and topsoil is still moist, but D0-S will be considered (based on precipitation percentiles and weekly minimums) if the dryness continues.
In the FSM, Fananu has been missing for the last couple months, so a drought analysis could not be made. The NWS station at Yap did not have data past December 27, so that station’s data could not be used since 4 days were missing. The drought analysis for the Yap archipelago was based on data at Rumung and North Fanif. Based on the data available at the time of this analysis, the week was wet at northern stations like Chuuk (7.80 inches) and Pohnpei (4.28), but dry at southern and eastern stations like Kosrae (0.24), Kapingamarangi (0.11), and Nukuoro (0.08). Lukonor was wet with 2.42 inches of rain. No rain was measured at North Fanif and Rumung, but these two stations had 8.41 inches and 6.24 inches, respectively, for the month. D-Nothing continued across the FSM. However, this week marks the third consecutive dry (less than the 2-inch weekly minimum needed to meet most water needs) at Kapingamarangi, so D0-S may be considered if the dryness continues.
With the observer off-island, Utirik was missing this week and could not be analyzed. Jaluit (0.33 inch) and Majuro (0.99) were dry this week (less than the 2-inch weekly minimum) while Ailinglapalap (2.40), Kwajalein (3.15), Mili (5.23), and Wotje (3.50) were wet. With this week wet, last week’s D0-S was changed to D-Nothing this week at Kwajalein and Wotje. Even though Majuro has recorded 13.03 inches of rain for December, the last 3 weeks were dry and the reservoir level has steadily declined throughout the month. The December 31 reservoir storage was 24.6 million gallons, or 68% of maximum, which is below the 80% threshold for drought concerns. Based on the recent dryness and on the reservoir level, the status at Majuro was changed from D-Nothing to D0-S. D-Nothing continued at the rest of the RMI stations.
The SPCZ gave American Samoa a wet week. Based on data received so far (through December 30), Pago Pago reported 5.23 inches of rain and the automated stations at Siufaga Ridge and Toa Ridge received 3.97 and 3.54 inches, respectively. With the last several weeks and month (16.77 inches at Pago Pago) wet (more than the 1-inch weekly and 4-inch monthly minimums), D-Nothing continued at Tutuila.
Virgin Islands
A couple frontal boundaries brought showers to the U.S. Virgin Islands (USVI) during this USDM week (12/25/19-12/31/19), mostly to the northern islands. Along with the fronts, moisture and trade winds dominated the lower levels of the atmosphere, while drier air and a building subtropical ridge influenced the upper levels, especially during the last half of the week.
Radar-based estimates of rainfall for the 7 days ending at 12z on Tuesday, and a 7-day analysis provided by the San Juan National Weather Service, depicted 2 or more inches of rain across much of St. John Island and western parts of St. Thomas, half an inch or more over eastern St. Thomas and western St. Croix, and little to no rain over eastern St. Croix.
Based on data through December 30 or 31, the Henry Rohlsen AP had two-thirds of an inch (0.67) of rain this week, while the Christiansted 1.8 ESE CoCoRaHS station measured 0.66 inch. The station at East Hill reported 0.62 inch for the week and 2.23 inches for the month, or 77% of normal for the month. The Henry Rohlsen AP monthly total of 1.76 inches is 61% of normal and (based on xmacis data) ranks December 2019 as the 14th driest December in 60 years of data; this translates to the 23rd percentile or a D0 level of dryness. The October-December (through December 30, 2019) total of 5.51 inches ranks as the fourth driest October-December, or 6th percentile (D2 level); the July-December 2019 total (16.63 inches) ranks 9th driest (15th percentile, D1); the April-December total (23.89 inches) ranks 14th driest (23rd percentile, D0); and the January-December total (24.70 inches) ranks 8th driest out of 63 years (12th percentile, D1). The USGS Adventure 28 well is showing no recovery; the last several months have had a declining trend, but the groundwater level held steady this week. The USDM status for St. Croix continued at D1-SL on this week’s map.
Based on data through December 30, the Cyril E King AP station reported 2.01 inches of rain for this week, with a month-to-date total of 3.82 inches which is 133% of normal. The year-to-date total is 36.02 inches with a departure of -3.24 inches or 92% of normal. The Anna's Retreat 2.5 ESE CoCoRaHS station reported 0.76 inch of rain for the week. The USGS Grade School 3 well is lower than September 2019, but the groundwater level increased 3.4 feet this week. With these wet conditions, the USDM status for St. Thomas was changed to D-Nothing.
The volunteer station at Windswept Beach reported 1.22 inches of rain for the week (through December 30), bringing the monthly total to 5.86 inches and ranking December 2019 the sixth wettest December in 36 years of data. However, earlier months were dry. November-December 2019 had 7.80 inches, ranking as the 14th driest (which translates to the 39th percentile). October-December had 11.80 inches, ninth driest, and 25th percentile (in the D0 range). September-December 2019 had 15.79 inches of rain and ranked as the fourth driest such period (11th percentile, or D1). For the year, 2019 had 39.82 inches and ranked 8th driest (22nd percentile, D0). The USGS Susannaberg well is locally low, but the groundwater level rose slightly (half a foot) this week. Based on recent wetness but longer-term dryness, the status for St. John was changed from D0-S to D0-L.
Looking Ahead
During the next 5 days (January 2 to 6), another surface low is forecast to develop across the southern Great Plain on January 2. This surface low and trailing cold are likely to bring heavy rainfall (1 to 3 inches) to the lower Mississippi Valley and Tennessee Valley with more modest amounts (1 inch or less) along the East Coast. A low pressure system with onshore flow is expected to bring rain and high-elevation snow to the Pacific Northwest, beginning of January 4. Although rainfall of around an inch is forecast along the Texas Gulf Coast during the next week, dry weather is likely across the remainder of Texas. Mild temperatures are forecast to prevail across the continental U.S. during the first week of January 2020, while bitterly cold temperatures persist throughout Alaska.
The CPC 6-10 day extended range outlook (January 6 to 10, 2020) indicates a slight tilt in the odds for above normal precipitation across much of the central and northeastern U.S. Below normal precipitation is favored for the Southeast along with California and the Southwest. The highest confidence in the temperature outlook exists across Alaska where below normal temperatures are likely to persist into the second week of January. Below normal temperatures are favored for the Great Basin and Rockies, while a warming trend is anticipated across the south-central and eastern U.S.
Author(s):
Brad Pugh, NOAA/CPC
Richard Heim, NOAA/NCEI
Dryness Categories
D0 Abnormally Dry—used for areas showing dryness but not yet in drought, or for areas recovering from drought.
Drought Intensity Categories
D1 Moderate Drought
D2 Severe Drought
D3 Extreme Drought
D4 Exceptional Drought
Drought or Dryness Types
S Short-Term, typically less than 6 months (e.g. agricultural, grasslands)
L Long-Term, typically greater than 6 months (e.g. hydrologic, ecologic)
Source: National Drought Mitigation Center

