


California and National Drought Summary for January 21, 2020
Summary
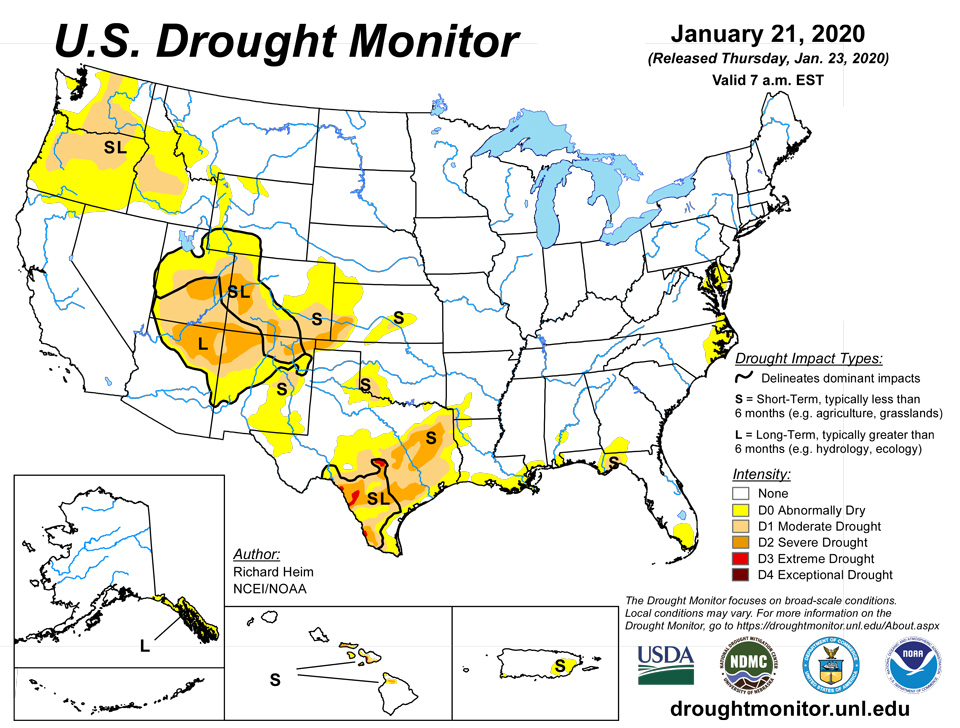
January 23, 2020 - Pacific weather systems migrated across the contiguous U.S. (CONUS) in a fairly westerly jet stream flow during this U.S. Drought Monitor (USDM) week. East of the Rockies, they tapped Gulf of Mexico moisture and dropped above-normal precipitation in a storm track that stretched from Texas to the Great Lakes. The jet stream flow amplified as the week progressed, producing a strong trough over the eastern CONUS with a ridge migrating across the West into the central CONUS. Cold arctic air was directed by the trough into the East behind surface frontal low pressure systems. The Pacific fronts dropped precipitation along the coastal ranges, but the air masses quickly dried out as they crossed the interior West, resulting in below-normal precipitation from the High Plains west to the coastal ranges. The Gulf of Mexico and Atlantic coasts were mostly drier than normal. Weekly temperatures were warmer than normal from Texas to the Mid-Atlantic, and colder than normal along the West Coast and northern to central Plains. Drought and abnormal dryness expanded across parts of the West, southern Plains and Gulf Coast, and Mid-Atlantic coast, but contracted in parts of the northern Rockies and southern to central Plains, as well as Hawaii and the Alaska panhandle.
Northeast
Half an inch to an inch of precipitation occurred across western and northern portions of the Northeast this week, with half an inch or less from southern New England to West Virginia. The Mid-Atlantic areas have been persistently dry with several drought indicators showing abnormal dryness for the last 1 to 6 months. These include the Standardized Precipitation Index (SPI), Standardized Precipitation Evapotranspiration Index (SPEI), soil moisture models, and some streamflow stations. As a result, the Delaware-Maryland D0 was expanded to encompass more of those two states.
Southeast
Parts of Alabama received over 2 inches of rain, with half an inch or more falling across most of Alabama, the Florida panhandle, the northern two-thirds of Georgia, and into the western Carolinas. Less than half an inch fell east and south of these areas and over southwest Alabama, with little to no rainfall over the southern half of Florida and parts of southern Georgia. D0 was expanded in southern Georgia, where SPI, SPEI, and soil moisture indicated dryness for the last 1 to 3 months, and across eastern North Carolina based on 1-6 month SPI, SPEI, and soil moisture deficits, and two spots of D0 were added in southwest Alabama. While dryness was also indicated for the last 3 months in northern Florida and central Virginia, no change was made to these areas this week, but they will be watched in the weeks ahead.
South
Bands of 2+ inch precipitation occurred across parts of Texas into central Oklahoma, and from eastern Texas into Mississippi, with some reports exceeding 5 inches. Half an inch or more of precipitation surrounded these areas across the region. But some areas had less than half an inch, including parts of western, southern, and east-central Texas, western Oklahoma, southeast Louisiana, and parts of Arkansas. For the dry areas, this week’s subnormal precipitation added to deficits stretching back 6 months or more. For the areas that were wet this week, the precipitation helped with short-term deficits, but longer-term deficits remained and were especially still severe at the 6-month time frame. The D2 in southwest Oklahoma was eliminated and its surrounding D0-D1 contracted. D0-D3 was contracted in the wet areas of Texas, but D0-D2 expanded in the dry areas. D0-D1 contracted in northwest Louisiana into adjacent Texas. Three-month precipitation deficits prompted expansion of D0 along the Louisiana coast into southern Mississippi.
Midwest
Half an inch to an inch of precipitation fell almost region-wide this week. Only Kentucky and a few areas of Iowa, Minnesota, and Wisconsin had less than half an inch. A strip of 1 to over 2 inches of precipitation was measured across Missouri and Illinois. Soils were wet across most of the Midwest, except parts of Ohio, and precipitation was above normal in most areas at most time scales from the last week to 12 months. There was no drought or abnormal dryness in the Midwest this week.
High Plains
Half an inch or more of precipitation fell across parts of the eastern Dakotas and eastern Kansas, with less than half an inch westward. Very little to no precipitation occurred across large parts of the western High Plains from Colorado to the Dakotas. D0 was trimmed in parts of southern Nebraska and adjacent Kansas. But D0 expanded in northeast Colorado into adjacent Nebraska, and a spot of D0 was added in north central Wyoming. Dry conditions were evident in northeast Colorado in many indices, especially SPI, SPEI, soil moisture, and groundwater indicators, and most notably at the 4-month time scale. Temperatures have been warmer than normal in this area, December was drier than normal, and very little precipitation has fallen in January. An area to watch is southeast Colorado, where reports note that winter wheat is suffering and soils are very dry, and evaporative demand (as measured by the EDDI [Evaporative Drought Demand Index]) is high, indicating the occurrence of warm temperatures, low humidity, and higher winds.
West
The Pacific weather systems have brought precipitation to coastal Oregon, Washington, and northern California this week, with 2 to locally over 5 inches measured in favored upslope areas. But this is the wet season and precipitation normals are high, so only a few parts of southwest Oregon, northwest California, and northwest Washington were wetter than normal for the week. The rain soaks the coastal soils and makes it wet in the short term, but the bigger hydrological picture is dry. Precipitation in the Pacific Northwest is below to much below normal for the water year to date (beginning October 1, 2019), and mountain snowpack is below normal in many areas. The Pacific fronts move quickly across the region, drying out as they cross the coastal ranges and leaving below-normal precipitation in interior Washington and Oregon. Streams are near to above normal along the coast, but below normal east of the coastal ranges. Other indicators reveal dryness east of the coastal ranges, including soil moisture, SPI, and SPEI, especially for the 1 to 9 month time scales. As a result, the 3 D1 areas in interior Washington and Oregon were joined, and D0 expanded in northeast Washington. D0-D1 expanded in southeast Idaho and D0 expanded in southwest Montana, where 3-month precipitation deficits were notable. But above-normal precipitation over the last 30 days prompted contraction of D0 in the Idaho panhandle and adjacent Montana, and in parts of eastern Idaho. The impacts indicator in the Pacific Northwest was changed from S to SL to indicate both short-term and long-term precipitation deficits.
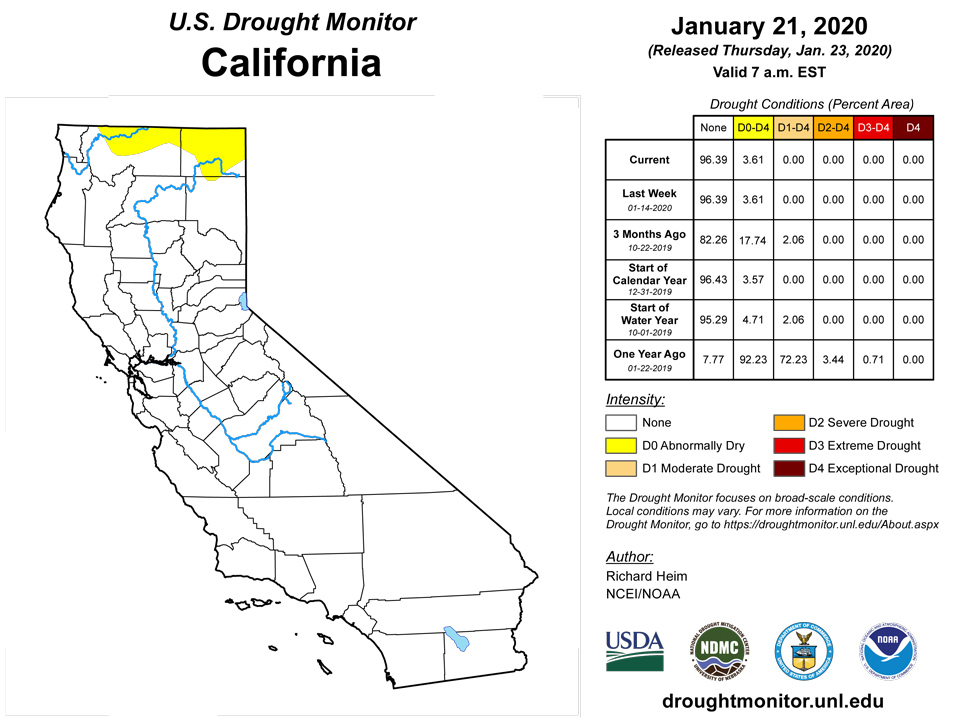
Precipitation in California ranged from over 2 inches in the northwest to an inch or more in favored upslope areas of the coastal and Sierra Nevada ranges. Half an inch or less fell in the central valleys. Parts of northeast Nevada and the Rockies had half an inch or more of precipitation, but much of the rest of the West was dry with a tenth of an inch or less precipitation falling. In New Mexico, impacts from ranchers in the southeast related poor grass growth due to hot, dry, windy conditions, with no grass for grazing in some areas. The poor grasslands can be traced to lack of rain from spring 2019 and the failure of the summer and fall monsoon rains. D0 was expanded into southeast New Mexico and adjacent Texas based on a combination of 1-6 month precipitation deficits, 1-month SPI, 1-9 month SPEI, soil moisture, and groundwater indicators. These indicators also justified the introduction of a spot of D1 in Guadalupe, DeBaca, and Torrance Counties.
Alaska, Hawaii, and Puerto Rico
In Alaska, the last 2 weeks have been dry across most of the state, especially in the southern coastal areas and panhandle where it's also been colder than normal. SNOTEL snow water content (SWE) is much below normal in the south central coastal area and below normal in the panhandle, and 1-month SPI is dry in the south central coastal area. But 30-90 day precipitation is near to wetter than normal. Warmer temperatures, lower loads, and above-normal precipitation in the Alaska panhandle have improved water levels and allowed Alaska Electric Light and Power (AEL&P) to reconnect all interruptible customers, so the D1 in the panhandle was removed. AEL&P noted that, throughout the winter, they will continue to monitor reservoir levels to ensure that hydropower remains available to their customers.
Hawaii has been drying out this week, but streamflow was still near to above normal across the state. Satellite-based observations of vegetation (NDVI) and ground observations indicate continued easing of drought in some areas. D0-D2 were contracted on Lanai and west Maui, and D0-D1 were contracted on The Big Island. No change was made to the D0 on Puerto Rico.
Pacific Islands
During the Northern Hemisphere winter, the North Pacific subtropical high, and the low latitude Inter-Tropical Convergence Zone (ITCZ), migrate south toward the equator. The seasonal migration brings drier subtropical trade winds to the northern portions of Micronesia and ITCZ rainfall to the southern regions. The weather conditions across the U.S.-Affiliated Pacific Islands (USAPI) during this USDM week (1/15/20-1/21/20) reflected this seasonal pattern. A dry season trade-wind regime was firmly entrenched over all the main islands of Micronesia. A near-equatorial trough was to the south, affecting mainly Kapingamarangi and Nukuoro, plus Indonesia and Kiribati. A couple cold front/shear lines penetrated into Marianas and western Federated States of Micronesia (FSM) waters and the northern Marshall Islands (RMI). Weak surface troughs briefly made an appearance in the central FSM but lingered over the RMI, while trade-wind disturbances brought a few showers to the Marianas and the RMI. South of the equator, Tropical Cyclone Tino (04F) moved west then south of the Samoan Islands. The track kept Tino away from American Samoa, but it was close enough that its wind and rainbands affected the islands. Concurrently, the monsoon trough (South Pacific Convergence Zone, SPCZ) lined up over the islands, enhancing rain over American Samoa.
Satellite-based estimates of 7-day precipitation (QPE) showed very little rain across Micronesia. Scattered areas of 1-4 inches were seen in parts of the southern FSM, and a larger area was south and east of the RMI. This larger area was part of an extensive area of rainfall which was along and just south of the equator and which extended southeast toward and past the Samoan Islands. This 4+ inch heavy rain area was associated with the ITCZ and SPCZ. It should be noted that the satellite QPE is able to detect broadscale synoptic rain patterns but does not capture smaller convective showers well.
Dry conditions persisted this week across Palau, receiving only 0.08 inch of rain. This week marked the fourth consecutive week with precipitation totals less than 1 inch. The month of January (as of January 21) had only 0.92 inch of rain. Due to the persistent dryness affecting Palau, abnormal dryness continued this week.
Dry conditions continued to affect the Marianas Islands this week, with all three stations having less than 1 inch of rain. Rota had the most precipitation at 0.70 inch of rain, while Guam had 0.63 inch, and Saipan’s manual gauge had 0.19 inch (ASOS: 0.10 inch; NPS 0.10 inch). During the last two months, Guam’s monthly precipitation totals have been less than 2 inches of rain, which is much less than the monthly threshold of 4 inches to meet most water needs. Guam’s International Airport had only 2.73 inches of rain from December 2019 through January 21, 2020, which is 28.5% of normal precipitation. For this reason, drought classification was deteriorated to moderate drought (D1-S) for Guam. Rota and Saipan continued to be in abnormally dry conditions this week.
All stations across the FSM had a dry week as they all received less than their 2-inches weekly threshold to meet most water needs. The stations with the least precipitation were Yap (0.04 inch; 2 days of missing data), Kosrae (0.09 inch), Pingelap (no rain was observed during this week), and Woleai (0.03 inch), which had less than a tenth of an inch of rain or no rain at all.
Yap, Lukunor, and Woleai had at least three to four weeks of precipitation totals less than 1 inch of rain. For this reason, their drought classification was changed to abnormally dry. Kapingamarangi, Pohnpei, Chuuk Lagoon, Kosrae, and Pingelap had drought free conditions this week as this was only the first or second week with precipitation totals below the weekly 2-inches threshold.
Nukuoro had 1.25 inches of rain this week and a total of 9.63 inches of rain for the month so far. Since the January precipitation total was more than the monthly threshold of 8 inches, drought free conditions remained in Nukuoro this week. Ulithi only had 0.17 inch this week, however, last week 7.92 inches of rain fell, securing Ulithi’s drought free status this week. Fananu had no data and was set to missing.
Dry conditions were present across the Marshalls Islands, with all stations analyzed receiving less than half of an inch of rain or no rain at all. The stations located in Majuro and Jaluit had no rain during the week, with Mili and Ailinglapalap reporting only 0.01 and 0.05 inch of rain, respectively. Ailinglapalap, Kwajalein, and Jaluit’s drought classification was changed from D-Nothing to abnormally dry conditions as this was at least the third consecutive week with little to no rain.
Three of the last four weeks have been dry for Majuro, receiving less than the weekly minimum of 2 inches of rain to meet most water needs. According to Majuro’s Water and Sewer Co, Majuro’s reservoir levels were at 66.8% of the maximum capacity of 36 million gallons (as of January 21, 2020), which is well below the critical 80% threshold. For this reason, Majuro’s drought classification was also changed to abnormally dry conditions.
Wotje and Mili were the only two stations that had drought free classifications for this week as this was only the second consecutive week with precipitation totals less than the weekly threshold of 2 inches. Utirik was set to missing this week due to insufficient data at the time of analysis.
Very wet conditions were observed in Tutuila during this drought week as 9.21 inches of rain fell in Pago Pago. This is over twice the monthly precipitation total of 4 inches to meet most water needs. The other stations located in Siufaga Ridge and Toa Ridge also saw wet conditions with precipitation totals at 5.18 inches and 5.80 inches, respectively. Dryness or drought development was not a concern for Tutuila and drought free conditions persisted this week.
Virgin Islands
St. Thomas precipitation total for the week was 0.67 inch at the Cyril E. King Airport and 0.72 inch at the CoCoRaHS station at Anna’s Retreat. For the month-to-date, the airport had 2.10 inches of rain, which is 126.5% of normal January precipitation. The CoCoRaHS station was slightly higher at 3.47 inches of rain. SPI values at all levels indicated drought free conditions for St. Thomas.
St. Croix’s airport precipitation for the week was only 0.29 inch of rain; however, the CoCoRaHS station at Christiansted was higher at 1.02 inches. The month-to-date rainfall of 2.23 inches at the airport was 147.7% of normal January precipitation. The CoCoRAHS station had 2.5 inches of rain for the month-to-date. However, SPI values at the 3, 9, and 12 months indicated moderate drought conditions, while the 6 month SPI value (-1.44) indicated severe drought. For this week, moderate drought continued in St. Croix.
This week’s precipitation total was 1.47 inches at Windswept Beach. The month-to-date precipitation of 3.81 inches was 130.0% of normal precipitation and the wettest January since 2008 and, as of January 21, the sixth wettest January since 1993. January 1996 is the wettest January with 5.98 inches of rain for the month. SPI values at all levels indicate drought free conditions for this location. For this reason drought free conditions were unchanged for St. John this week.
Looking Ahead
Pacific weather systems will continue to cross the CONUS in a westerly jet stream flow. For January 23-28, 3 or more inches of precipitation is forecast for the northern California to Washington coast and coastal ranges, with an inch or more across parts of the Rockies, especially the northern Rockies. An inch or more of precipitation will be widespread from central Texas to the Tennessee Valley, across parts of the central Plains to Midwest, and from northeast Georgia to New England. Half an inch or less of precipitation is predicted for the rest of the West to central and northern Plains, and parts of Florida and the Great Lakes. Temperatures are forecast to be warmer than normal for much of the CONUS. For January 29-February 1, odds favor above-normal precipitation across eastern Alaska and the panhandle as well as most of the CONUS. Below-normal precipitation is expected for western Alaska, parts of the southwestern CONUS, and northern portions of the Great Lakes and New England. Odds favor a continuation of warmer-than-normal temperatures across most of the CONUS and the Alaska panhandle, with below-normal temperatures in the Four Corners area and across most of Alaska.
Author(s):
Richard Heim, NOAA/NCEI
Ahira Sanchez-Lugo, NOAA/NCEI
Dryness Categories
D0 Abnormally Dry—used for areas showing dryness but not yet in drought, or for areas recovering from drought.
Drought Intensity Categories
D1 Moderate Drought
D2 Severe Drought
D3 Extreme Drought
D4 Exceptional Drought
Drought or Dryness Types
S Short-Term, typically less than 6 months (e.g. agricultural, grasslands)
L Long-Term, typically greater than 6 months (e.g. hydrologic, ecologic)
Source: National Drought Mitigation Center

