


California and National Drought Summary for January 28, 2020
Summary
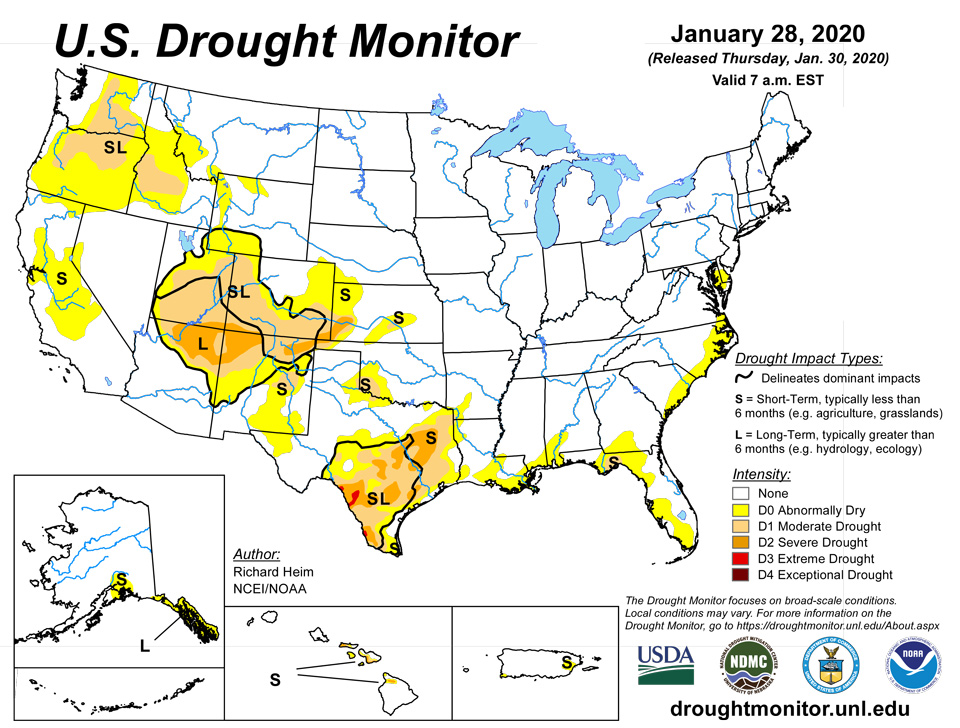
January 31, 2020 - A series of Pacific weather systems continued to move across the contiguous U.S. (CONUS) in a fairly westerly jet stream flow during this U.S. Drought Monitor (USDM) week. The systems dropped copious amounts of precipitation along the Coastal and Cascade mountain ranges of Northern California and the Pacific Northwest, with above-normal precipitation continuing across most of the Pacific Northwest to the Rockies. The Pacific systems were dried out once they crossed the Rockies, but some picked up Gulf of Mexico moisture to provide above-normal precipitation from parts of New Mexico northeastward to the Great Lakes. Surface lows were generated by the upper-level Pacific systems, with some tracking to the Northeast and others moving along the Gulf Coast. The Gulf lows gave Texas to the Lower Mississippi Valley above-normal precipitation, while the others generated above-normal precipitation in the Middle Appalachian to Mid-Atlantic states. It was drier than normal from California to the Rio Grande Valley, across most of the northern Plains and Southeast, and parts of the central High Plains and Ohio Valley. With a westerly flow, most of the CONUS was warmer than normal, with only the Southeast having near to cooler-than-normal temperatures.
Northeast
Half an inch to an inch of precipitation occurred across most of the Northeast this week, with locally 2 or more inches in southern portions and less than half an inch in parts of northern New England. According to the National Weather Service (NWS), the 2.54-inch total in Wilmington, Delaware, on January 25 was the third-wettest January day on record, behind a pair of 2.60-inch amounts (on January 3, 1936, and January 22, 1902). With an inch or more of precipitation falling over Maryland and Delaware, resulting in improving Standardized Precipitation Index (SPI) values, the western and northern portions of the D0 over this area were trimmed. Otherwise, no change was made to the Northeast.
Southeast
Most of Florida to the coastal Carolinas had half an inch or less of precipitation this week. Otherwise, half an inch or more of precipitation was widespread across the Southeast from Alabama to Virginia, with an estimated (based on radar) 2 inches or more locally from northeast Georgia to northern Virginia. D0 spread further down the North Carolina coast into the South Carolina lowlands, and D0 expanded across parts of Florida and southern Georgia and further in southwest Alabama, based on mounting deficits over the last one to 3 months. In coastal North Carolina, groundwater levels and surface streamflows were starting to fall into the below-normal range. According to U.S. Department of Agriculture (USDA NASS) statistics, 38% of pasture and rangeland was in poor to very poor condition in Virginia, and there were reports that “hay supplies are tight due to poor hay production in the fall.” The poor conditions in the Southeast were due to autumn drought, followed by insufficient time for re-growth before winter. For this reason, and because substantial rain occurred this week, no new D0 was added to central Virginia where 6-month precipitation deficits were evident. The USDA statistics also noted that 19% of the North Carolina pasture and rangeland was in poor to very poor condition.
South
Eastern portions of the South region received widespread half inch or more of precipitation, while western Texas was dry, especially along the Rio Grande Valley. An inch or more of precipitation fell from eastern Texas and southeast Oklahoma to the Mississippi River, with embedded areas of 2+ inches along the Gulf Coast and from northern Louisiana to southern Arkansas. Half an inch or more also fell in the Oklahoma panhandle and northern portions of the Texas panhandle. Consequently, drought and abnormal dryness contracted in parts of Texas, Oklahoma, Louisiana, and Arkansas. But drought or abnormal dryness expanded or intensified in parts of western Texas, southern Louisiana, and southeast Mississippi. The USDA reported that 28% of Tennessee’s pasture and rangeland was in poor to very poor condition, but, as for the Southeast, this was due to autumn drought, followed by insufficient time for re-growth before winter.
Midwest
Less than 0.25 inch of precipitation fell across most of Minnesota and parts of southeast Illinois to southwestern Indiana, while most of the Midwest received half an inch or more, and locally more than an inch. With most of the region experiencing wet conditions for the last 1 to 12 months, there was no drought or abnormal dryness in the Midwest this week.
High Plains
Much of the High Plains region had less than a tenth of an inch of precipitation this week. Half an inch or more fell across southeastern Nebraska to southern Kansas and in the mountains of Colorado and western Wyoming, with pockets of 0.25-0.50 inch elsewhere. Although 6-month precipitation deficits are still significant, D2 was deleted in western and southern Colorado where recent precipitation made 1 to 3-month precipitation deficits and drought indicators less severe and where mountain snowpack was near normal. D0-D2 were trimmed slightly in southwest Kansas where precipitation was above normal this week. Reports from eastern Colorado indicate that the recent lack of precipitation is deteriorating conditions. Topsoil is blowing about in the wind, and winter wheat needs more moisture before green-up, so this area will be watched for deterioration in the coming weeks. Based on USDA reports, topsoil moisture was short to very short (dry to very dry) across 61% of Colorado, 32% of Kansas, and 24% of Wyoming; 23% of the pasture and rangeland was in poor to very poor condition in Colorado; and 24% of Colorado’s winter wheat and 23% of winter wheat in Kansas was in poor to very poor condition. USDA reports from Colorado’s southeastern counties included: “conditions were noted as extremely dry and moisture was needed. A reporter noted high winds severely damaged or blew out winter wheat stands in [some] areas. Livestock were being heavily supplemented.”
West
The Pacific weather systems continued to drop several inches of precipitation across coastal areas of Oregon, Washington, and northern California. More than 2 inches was estimated from radar across the coast to Cascades, with 5 inches widespread and locally over 10 inches occurring in parts of Washington. Their westerly track and fast movement dried them out once they traversed the Cascade range, with half an inch to an inch of precipitation falling in the lee areas of Washington and less than half an inch in the Oregon lee regions. The persistent precipitation has made up for deficits over the last month across the coastal regions, and last 2 months in western Washington, but deficits are still widespread and severe for the last 3 to 24 months. Mountain snowpack (SNOTEL snow water equivalent, or SWE) was improved in some basins. But with warmer-than-normal temperatures causing the precipitation to fall more as rain rather than snow, many other basins across the Pacific Northwest still had below-normal SWE values. The western edge of D0-D1 was pulled back in Washington and Oregon to reflect the persistent precipitation, and D1 was pulled back in north central Washington and central Oregon, but otherwise no change was made to the depiction in the Pacific Northwest.
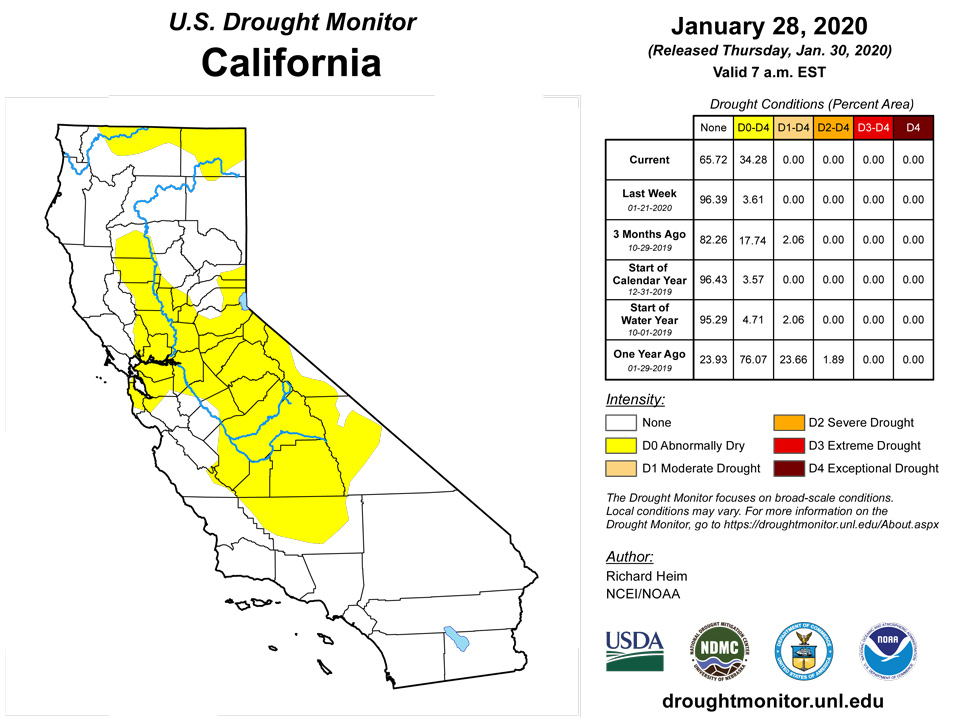
Northern California received 2 or more inches of precipitation this week, but amounts dropped off rapidly to the south, with little to no precipitation falling in Southern California to southern Nevada. Pockets of half an inch or more of precipitation occurred over the higher elevations of Utah and the Four Corners. In California, according to the state Department of Water Resources, Sierra Nevada snowpack, which was 105% of average (for the date) on December 23, stood at 74% of the late-January average on January 28. January has been quite dry across the state, with precipitation deficits occurring in places out to the last 6 months. As a result, a large area of D0 was added to the central valleys and from the Bay area to the Sierra Nevada, stretching into the Reno area of Nevada. According to USDA reports, 65% of topsoil moisture was short to very short, and 87% of winter wheat was in poor to very poor condition, in New Mexico. In northeastern New Mexico, “wheat was stressed from the lack of moisture.” But precipitation this week and previous weeks has lessened deficits in the Great Basin to southern Rockies, resulting in pullback of D0 in western Utah and deletion of D2 in east-central Utah and north central New Mexico.
Alaska, Hawaii, and Puerto Rico
This week was wetter than normal in the panhandle of southeastern Alaska, but drier than normal across the rest of the state. Dry conditions in the south central area, around Cook Inlet and Anchorage, were evident in the SPI for the last 1 to 6 months, and SWE values were in the tenth percentile or drier, so a new area of D0 was added here. In Hawaii, continued improvement of vegetation and pastures prompted pullback of D0-D2 on Molokai, elimination of the D3 on Maui, and a 1-category improvement on Kahoolawe. Above-normal rain fell across southern and eastern Puerto Rico this week. With wet conditions for the last 1 to 2 months, D0 was pulled back in eastern Puerto Rico, with the remaining D0 reflecting dryness at the 3 to 6-month time scales here.
Pacific Islands
During the Northern Hemisphere winter, the North Pacific subtropical high, and the low latitude Inter-Tropical Convergence Zone (ITCZ), migrate south toward the equator. The seasonal migration brings drier subtropical trade winds to the northern portions of Micronesia and ITCZ rainfall to the southern regions. The weather conditions across the U.S.-Affiliated Pacific Islands (USAPI) during this USDM week (1/22/20-1/28/20) reflected this seasonal pattern. Several weak circulations developed within the ITCZ along and near the equator, while a fresh to strong trade-wind pattern kept the weather mostly dry across much of western and northern Micronesia. Divergent flow aloft and convergent trade-winds at the surface occasionally enhanced precipitation associated with the ITCZ. Weak surface troughs developed briefly in the lower latitudes, while a few trade-wind disturbances and several cold front/shear lines traversed the northern latitudes. As noted by the National Weather Service (NWS) office in Guam, January is the most common month for shear lines in the Marianas, which is why February, March, April and May are the core of dry season. Those months still lie ahead, and fire weather will start to figure prominently, most likely. South of the equator, an active monsoon trough (the South Pacific Convergence Zone, SPCZ) held sway just north and east of the Samoan Islands. Circulations developed as the SPCZ shifted over the islands, including Tropical Disturbance 05F which was designated Tropical Cyclone 12P as it moved south. Heavy rain, associated with TD 05F as it developed, fell on top of already saturated ground, causing landslides and flooded roads.
Satellite-based estimates of 7-day precipitation (QPE) showed a band of 1+ inches of rainfall across southern Palau and southern Yap State which stretched east-northeast into the eastern Federated States of Micronesia (FSM) and Marshall Islands (RMI). Two to locally more than 4 inches of rain were indicated in eastern sections of this band. A few areas of half-inch or more rainfall was indicated across northwest Micronesia, but otherwise little to no rain was detected by the QPE in the northern areas. The SPCZ was evident as a large northwest to southeast band of 4+ inches of rain. The edge of this band touched the Samoan Islands, but the heaviest rain areas remained to the north and east.
Abnormally dry conditions persisted this week in Palau since only 0.57 inch of rain fell this week, which is less than the weekly 2-inches threshold to meet most water needs. With data through January 28, the January 2020 monthly total was only 1.68 inches of rain, which is 6.32 inches less than the monthly 8-inches of rain needed to meet most water needs and, so far, the driest January since records began in 1952. The now second driest January on record took place in 1973 with a total of 2.11 inches of rain.
Two of the three stations analyzed in the Marianas Islands had precipitation totals near or slightly above the weekly 1 inch threshold to meet most water needs. Guam had the highest rainfall total at 1.02 inches, followed by Rota with 0.85 inch of rain. Saipan had the least rainfall, receiving only 0.26 inch (ASOS: 0.16 inch; NPS: 0.27 inch). The monthly rainfall total for Saipan is 1.53 inches, with data through January 28. Following a very dry December, Rota and Guam’s January 2020 rainfall totals were also below the 4-inches monthly threshold at 2.99 and 2.53 inches, respectively. For this week, abnormally dry conditions continued across Saipan and Rota, while Guam continued in moderate drought.
Several stations across the FSM had a dry week. Yap (0.05 inch; 3 days of missing data), Woleai (0.10 inch of rain; 2 days of missing data), and Lukunoch (0.19 inch; 3 days of missing data) had the least precipitation this week with less than half an inch of rain. For Woleai, the monthly rainfall total, as of January 28, was 1.18 inches of rain and the third driest January on record, behind 2016 (0.34 inch) and 1973 (0.80 inch). Similarly, Yap’s and Lukunoch preliminary monthly totals of 1.45 and 1.23 inches of rain, respectively, were the second driest January on record. For Yap, only January 1983 was drier with a rainfall total of 1.25 inches, while January 1998 was drier for Lukunoch at 0.31 inch. These three locations remained in abnormally dry conditions this week.
Chuuk Lagoon, Pohnpei, Kapingamarangi, and Ulithi had less than their 2-inch weekly threshold to meet most water needs. However, they all remained in drought free conditions as they received close to or slightly surpassed the threshold of 8 inches of rain for the month to meet most water needs.
Kosrae, Nukuoro, Pingelap were the only stations with over 3 inches of rain for the week. Nukuoro had the highest rainfall total at 6.04 inches, resulting in 15.67 inches for the month so far. All three stations continued to be in drought free conditions as their monthly totals were close to or above the monthly threshold of 8 inches.
Most of the analyzed stations across the Marshall Islands had a dry week, receiving less than 2-inches of rain to meet most water needs. Wotje had no precipitation this week, marking the third consecutive week with little to no rain. The monthly rainfall total for Wotje was only 3.87 inches. For this reason, abnormally dry conditions were introduced this week for Wotje.
Kwajalein, Majuro, and Utirik had less than 2-inches of rain to meet most water needs for the week. Kwajalein and Utirik had less than 4 inches of rain for January 2020, which is less than the 8-inches threshold to meet most water needs. For Utirik, this month marked the second consecutive month with rainfall totals below 4 inches. Majuro’s January 2020 rainfall total was 5.85 inches. As of January 28, Majuro’s reservoir levels were at 67.2% of the maximum capacity of 36 million gallons, which is well below the critical 80% threshold. Abnormally dry conditions continued this week for these three locations.
Three stations (Ailinglapalap, Jaluit, and Mili) had a wet week with more than 2 inches of rain. Mili had the highest rainfall amount for the week at 7.43 inches of rain. Dryness or drought development was not a concern for Mili and drought free conditions persisted. Meanwhile, Jaluit and Ailinglapalap’s drought classification of abnormally dry persisted this week as this was the second consecutive month where their monthly rainfall totals were less than 8 inches to meet most water needs.
During this drought week, Pago Pago, Tutuila had a total of 7.27 inches of rain, with neighboring stations reporting 2.29 (Siufaga Ridge) and 3.19 (Toa Ridge) inches of rain. The monthly rainfall total for Pago Pago, as of January 28, was 20.89 inches, which is five times the monthly threshold of 4 inches to meet most water needs. Drought development was not a concern for Tutuila this week.
Virgin Islands
St. Thomas weekly rainfall totals were 0.95 inch of rain at the Cyril E. King airport and 0.16 inch at the CoCoRaHS station at Anna’s Retreat 2.5 ESE. For the month-to-date, the airport had 3.05 inches, which is 138.6% of normal rainfall. Similarly, the CoCoRaHS station had a total of 3.63 inches of rain for the month. Groundwater levels at the Grade School 3 Well have been increasing, going from 6.83 feet below land surface on January 24 to 5.46 feet below land surface. SPI values at all levels indicate drought free conditions.
Similarly, St. John had a total of 1.2 inches for the week at the Windswept beach. The month-to-date rainfall total of 5.05 inches was 2.12 inches above average or 172.4% of normal precipitation. This was also the second wettest January since 1984, falling behind 1996 (5.98 inches). SPI values also indicate drought free conditions and groundwater levels have been increasing since January 23.
Rainfall totals for St. Croix varied from 0.60 inch at the Henry E. Rohlsen airport to 2.81 inches at the Christiansted 1.8 ESE CoCoRaHS station. The month-to-date rainfall total was 2.83 inches or 143.7% of normal precipitation at the airport and 5.31 inches at the CoCoRaHS station. Groundwater levels at the Adventure 28 Well have slightly increased to 19.40 feet below land surface as of January 28. SPI values indicate drought free conditions at the 1-month, however, the 3, 9, and 12 months indicates moderate drought. The 6-month SPI value of -1.64 indicates extreme drought. Moderate drought conditions persist for St. Croix this week.
Looking Ahead
A low pressure system brought precipitation to the southern Plains during Tuesday, January 28, after the cutoff time for this week’s USDM, and it moved across the Southeast on Wednesday, January 29, while another Pacific system brought precipitation to the Pacific Northwest. During the next 2 weeks, Pacific weather systems will continue to cross the CONUS in a westerly jet stream flow, with low pressure systems also developing along the Gulf of Mexico coast. For January 30-February 3, 3 or more inches of additional precipitation are forecast for coastal Oregon and Washington, with an inch or more across the northern Rockies and 0.25 inch or more for the rest of the Pacific Northwest to northern High Plains, Great Basin to central Rockies, and east-central Arizona. Most of California, southern Nevada, and Arizona to New Mexico are forecast to be dry. Little to no precipitation is also predicted for much of the Plains. Half an inch or more is expected from eastern Texas to the Lower Mississippi Valley and the central Gulf Coast, with an inch or more widespread from Georgia to North Carolina and across southern Florida. Half an inch or less of precipitation is predicted for the rest of the country from the Mississippi River eastward. Temperatures are predicted to be warmer than normal across most of the CONUS, with some below-normal maximum temperatures in the Southwest. For February 4-8, odds favor below-normal precipitation from California to Utah, and across most of Texas to Oklahoma, while above-normal precipitation is favored across Alaska and most of the rest of the CONUS. The outlook calls for warmer-than-normal temperatures from the Mississippi River to East Coast and the Alaska panhandle, and colder-than-normal temperatures in the Southwest and much of Alaska.
Author(s):
Richard Heim, NOAA/NCEI
Ahira Sanchez-Lugo, NOAA/NCEI
Dryness Categories
D0 Abnormally Dry—used for areas showing dryness but not yet in drought, or for areas recovering from drought.
Drought Intensity Categories
D1 Moderate Drought
D2 Severe Drought
D3 Extreme Drought
D4 Exceptional Drought
Drought or Dryness Types
S Short-Term, typically less than 6 months (e.g. agricultural, grasslands)
L Long-Term, typically greater than 6 months (e.g. hydrologic, ecologic)
Source: National Drought Mitigation Center

